From discovery, visual investigation, to faster, confident decisions
Built for continuous discovery in real-world industrial environments.
Traditional BI tools are built to report on what already happened. They rely on predefined questions, fixed dashboards, and static views that break down when data is complex or conditions change.
Spotfire® Analytics is built for continuous discovery.
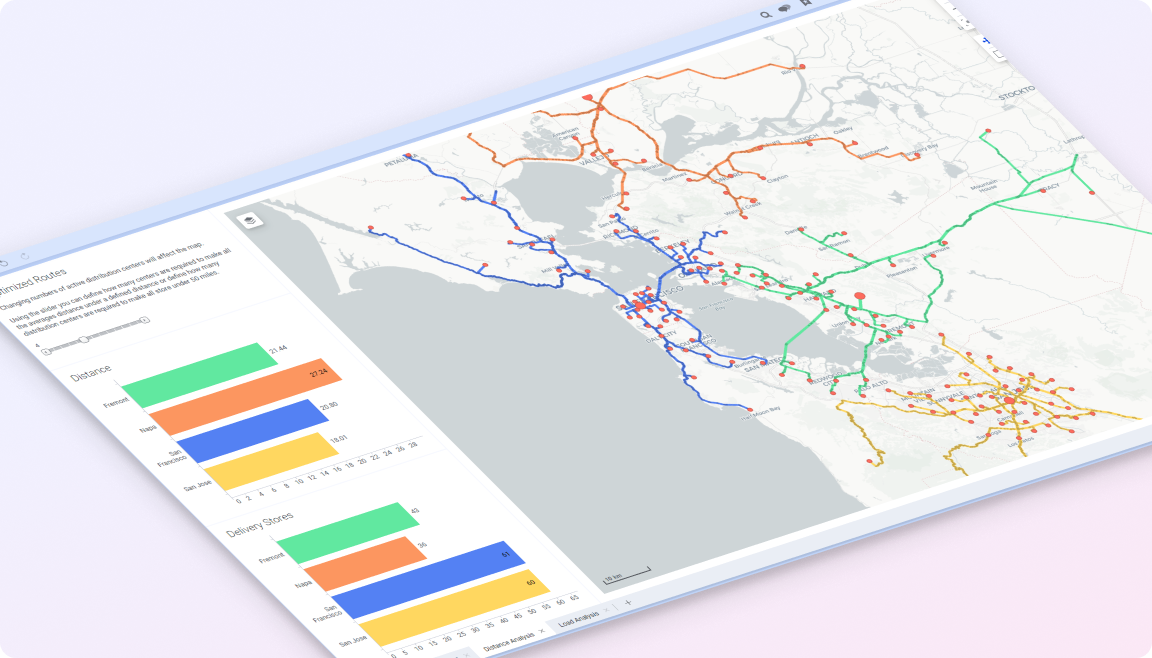
It enables users to explore industrial data visually, follow hypotheses as they emerge, and understand relationships across time-series, spatial, and multivariate data, all in context. Instead of waiting for new dashboards or exporting data to other tools, teams can interact directly with their data and move from observation to understanding faster.
The result is quicker insights, earlier issue detection, and more confident operational decisions.
Discover what’s happening, earlier
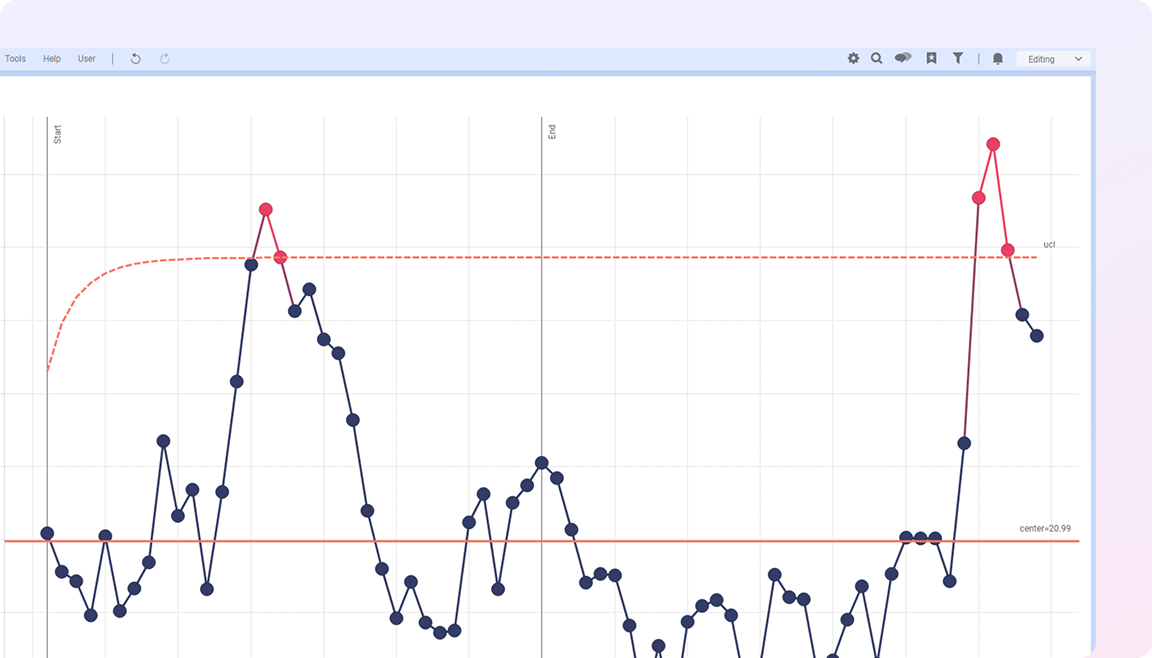
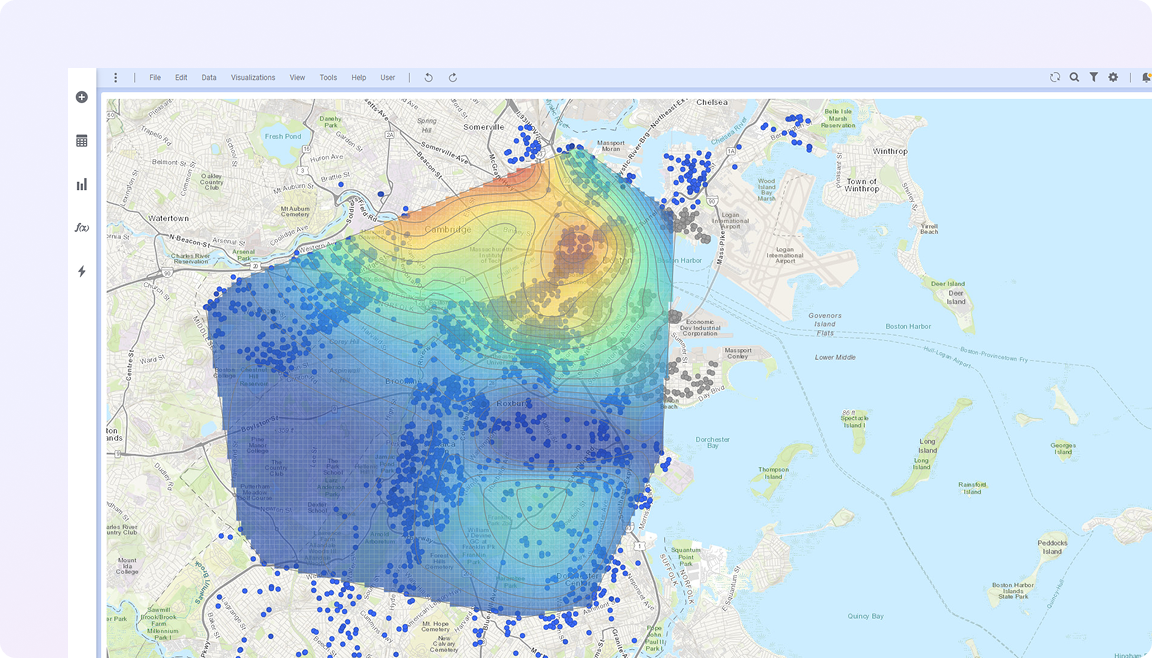
Spotfire Analytics helps teams reveal patterns, trends, and anomalies hidden inside complex industrial data as they emerge. By visually exploring time-series, spatial, and multivariate data, you and your teams can see relationships that static dashboards miss, allowing issues and opportunities to surface earlier, when there’s still time to act.
Ask and answer questions in real time
Instead of relying on predefined queries or waiting for new reports, Spotfire Analytics enables interactive exploration as questions evolve. Users can filter, drill down, and compare scenarios on the fly, following hypotheses as they form and getting answers faster, without handoffs or context switching.
Respond with confidence as conditions change
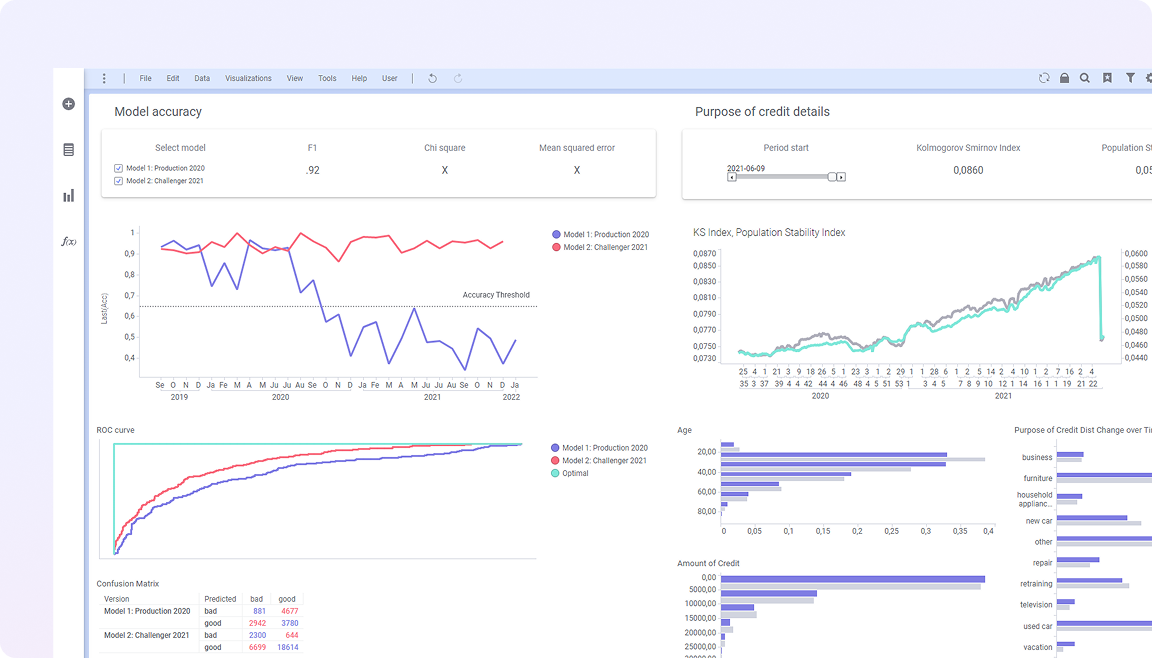
By combining historical and real-time data in one visual environment, Spotfire Analytics provides continuous situational awareness across operations. Teams can quickly assess impact, understand what’s changing, and make informed decisions with full context, even as conditions shift.
Designed for exploration, not reporting
Built for industrial data complexity
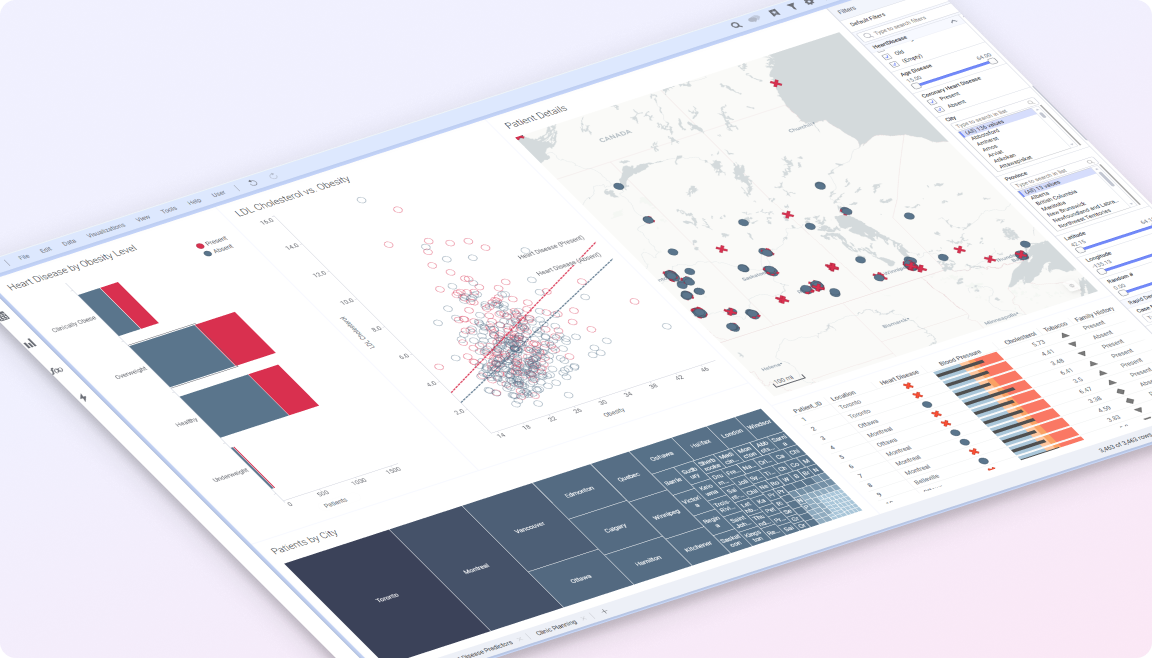
Spotfire Analytics is designed to handle the realities of industrial data, high volume, high dimensionality, and constant change. It supports exploration across time-series, spatial, and operational data without forcing simplification into static views.
Visuals that analyze, not just display
Every visualization in Spotfire Analytics is analytical by design. Visuals compute, compare, and reveal data structure, helping users reason through complex problems visually rather than relying on disconnected calculations.
AI that guides, not replaces
AI-assisted recommendations help surface relationships, outliers, and patterns during exploration, without taking control away from the user. Insight remains explainable, transparent, and driven by human judgment.
Solve your complex, mission-critical challenges with Spotfire
Spotfire Analytics helps teams move past dashboards and reports toward a more interactive, exploratory way of working with data.
By enabling visual reasoning, guided exploration, and real-time insight, Spotfire Analytics empowers teams to understand what’s happening, respond faster, and make better operational decisions, every day..