Spotfire® for Energy
Confident decisions in upstream complexity
Understand what’s happening, anticipate risk,
and act earlier across the system
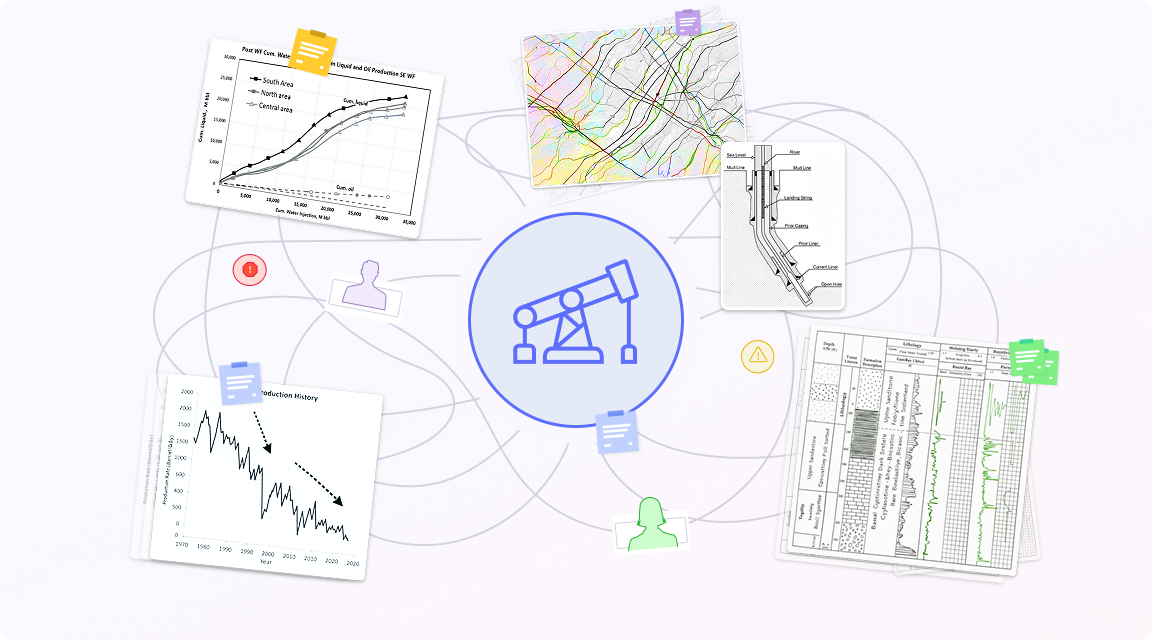
The challenge isn’t data. It’s fragmented insights.
Upstream energy organizations are rich in data, but insight is fragmented across disciplines. Subsurface, production, operations, and economics teams each see only part of the picture. Alignment happens late through manual workflows and stitched views. When insight is fragmented, decisions slow, leading to missed opportunities, increased risk, and lost value.
A decision layer built for upstream energy
Spotfire® Industry Pro sits above domain-specific tools, not in place of them. It brings subsurface, production, operational, and economic insight into a shared visual decision layer, making insights visible and comparable across disciplines in a common view where assumptions and differences are clear. Reducing manual handoffs and aligning teams without forcing standardization, to help teams surface risk earlier, accelerate alignment, and drive confident decisions across the full system.
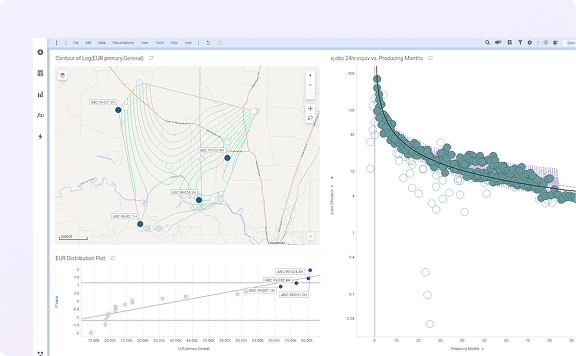
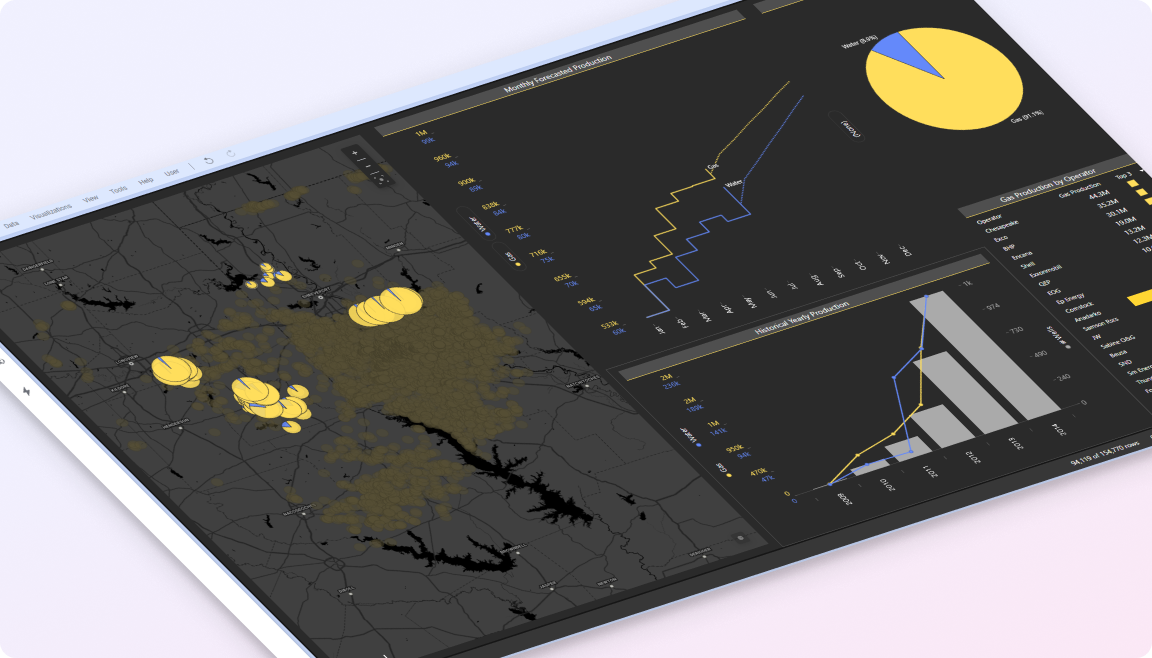
Asset valuation
Asset valuation often stalls because teams must first stand up detailed models in specialist tools before they can even determine which opportunities are worth pursuing. Spotfire enables rapid screening and prioritization across subsurface, production, operational, and economic signals, well before full project workflows are initiated. This early, visual evaluation helps teams surface risk sooner, pass confidently on suboptimal opportunities, and focus deep technical effort where it will deliver the greatest value.
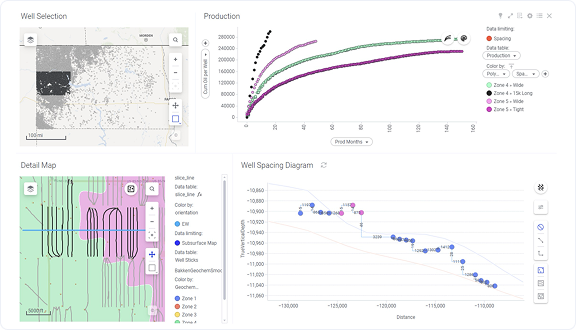
Field development
Field development decisions depend on synthesizing insights across geology, petrophysics, drilling, completions, and production; insights that are rarely evaluated together early enough. Spotfire brings these perspectives into a single, interactive decision layer, allowing teams to explore scenarios, benchmark development strategies, and identify performance drivers using built-in statistics and machine learning. The result is faster alignment, better-informed trade-offs, and development plans shaped by evidence rather than late-stage reconciliation.
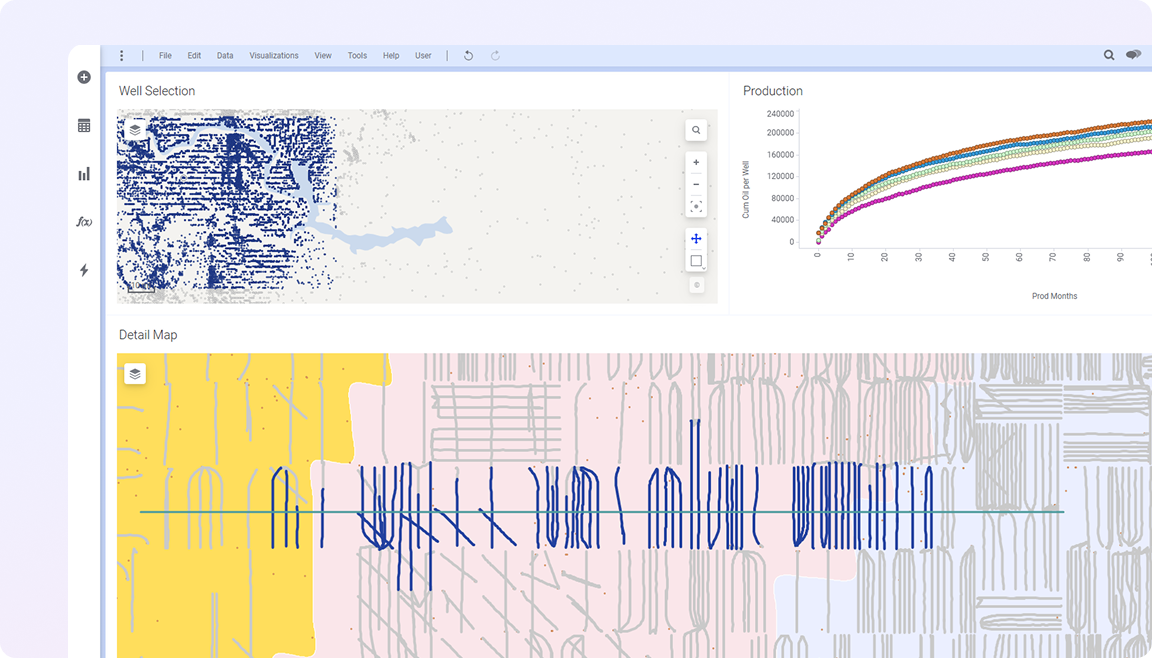
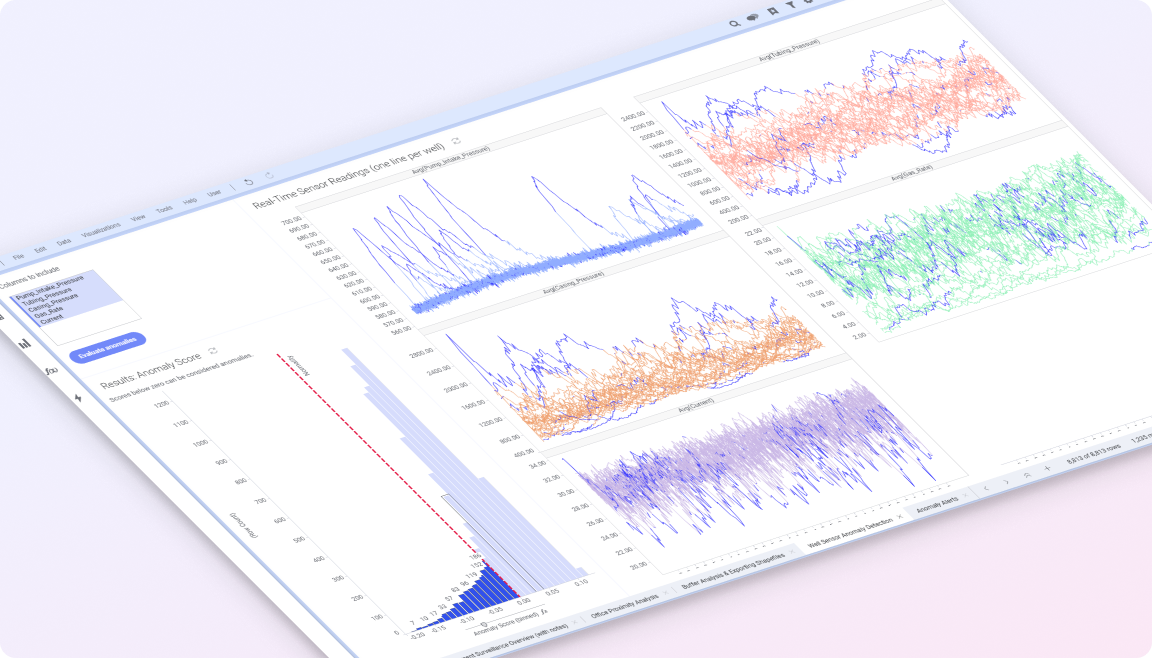
Production optimization
Production optimization requires understanding how wells, facilities, operating conditions, and constraints interact over time and space, but signals are often fragmented between real-time systems and historical analysis. Spotfire combines live sensor data with historical and spatial context to reveal emerging patterns around downtime, constraints, and performance degradation. This enables teams to act earlier, prioritize the right interventions, and prevent issues before they escalate into lost production.
Operational excellence
Operational excellence depends on early awareness, recognizing subtle deviations in asset and process behavior before they become incidents or failures. Spotfire provides operational insight in context, connecting trends, thresholds, and contributing factors across disciplines in a single view. Teams can detect risk sooner, coordinate responses more effectively, and establish repeatable, data-driven decision workflows that support safer, more reliable operations.
Powering top energy organizations
Hunt Oil stays ahead of the curve with smart IoT drilling
Spotfire empowers Hunt Oil to combine real-time and historical data—turning drilling insights into faster, smarter decisions.
The future of AI for energy
Decarbonization, regulatory pressures, and market fluctuations are pressuring the energy and utilities industry to rapidly transform.
Learn how AI and GenAI is changing the energy landscape, and how visual industrial analytics is at the forefront.

Discover more resources
Powering the future. Scaling energy and utilities with visual analytics


Harness the power of visual data science in energy
Read the e-book


Liberty Energy drives operational agility with real-time intelligence
Second-by-second visibility into live frac operations

S&P Global delivers data-driven customer value
80 percent time reduction for well attribute visualization and analysis
Diamondback Energy aligns operations, costs, and performance
Insights across facilities, wells, and financial operations