What is visual data wrangling?
Visual data wrangling is the practice of preparing and transforming data through direct, intuitive interaction with the data. Rather than writing scripts or queries, users explore and refine their data visually by dragging, filtering, and transforming it in place.
What is visual data wrangling?
Data is the currency of business, but raw data often isn’t ready for detailed analysis. That’s where data wrangling comes in. It’s the crucial first step in turning messy, complex data into something structured and useful. Traditional data preparation is often slow and/or code-heavy. Visual data wrangling removes that barrier, enabling users to work directly with their data to uncover issues, enrich context, and ultimately accelerate discovery.
Introduction to visual data wrangling
Visual data wrangling shifts the focus from code to conversation with your data. Instead of scripting or writing SQL queries, users manipulate data within an interactive canvas that’s built for exploration and analysis. This approach shortens the time between a question and an answer.
The Spotfire® visual data science platform exemplifies this method by making complex data preparation intuitive and fast, empowering data professionals and domain experts alike. The result? Business decisions are made faster, smarter, and with more confidence.
What are the key features of visual data wrangling?
With visual data wrangling, users can blend, clean, and reshape data as they analyze it. Every change is transparent and reversible, supporting a natural flow of exploration and refinement. Key features include:
- Drag-and-drop transformation building
- Real-time previews
- No-code operations (filter, join, pivot, calculate)
- Transparent, auditable workflows
- AI-powered transformation suggestions
- Accessible to all experience levels
These features make the wrangling process more accessible, significantly faster, and more accurate.
What industries use visual data wrangling?
From energy to manufacturing, industries that rely on large-scale, complex datasets have embraced visual data wrangling as a mission-critical capability. Here are a few standout examples.
Energy
The top 10 global energy companies use Spotfire to wrangle and analyze geospatial and real-time sensor data for exploration and production. In the energy sector, data is generated from countless sources—sensors, equipment, weather patterns, and customer usage data. Visual data wrangling enables energy companies to consolidate, clean, and analyze this disparate data quickly to drive better business outcomes.
Case in point: Enel Group. The global energy giant turned to Spotfire to navigate its complex digital transformation. Enel needed to integrate data from over 30 internal and external systems and gain real-time insights across its entire operational platform. Using Spotfire visual data wrangling and streaming analytics capabilities, Enel could monitor processes end-to-end, detect issues instantly, and make proactive decisions to optimize operations. As Ainhoa Ortiz del Río, Head of Integration and BPM Manager at Enel, put it: "We are very happy with Spotfire because we are handling analysis from a perspective that is technical but also for business people. It's not only about IoT or infrastructure monitoring, it's also for monitoring our own platform from a business perspective."
Through visual data wrangling, Enel achieved faster time to market, operational cost optimization, and greater agility—essential qualities in today’s fast-evolving energy landscape.
Manufacturing
High-tech manufacturers use Spotfire to analyze metrology data, wafer maps, and predictive maintenance metrics. Semiconductor and high-tech manufacturing generate enormous volumes of complex data. Visual data wrangling empowers manufacturing teams to process operational data faster, identify anomalies earlier, and optimize production workflows.
Case in point: STMicroelectronics. Facing the complexities of semiconductor production, STMicroelectronics adopted Spotfire across 12 global manufacturing sites to modernize its analytics and data governance practices. The company industrialized its interactive reporting processes by replacing a custom-built, difficult-to-maintain solution and improved operational performance.
With Spotfire visual data wrangling capabilities, engineering teams now develop their own field-level analyses, dramatically improving responsiveness to manufacturing issues. In the words of Guillaume Deschamps, Data and Analytics Subject Matter Expert at STMicroelectronics: "With Spotfire software, we have brought in new analytics practices and methods. Sharing across sites and organizations is now much easier. We are ready for the next era!"
Thanks to Spotfire, STMicroelectronics transitioned into a big data-driven manufacturing model, digitized daily visual performance monitoring, and expanded its analytics adoption to over 5,000 active users in less than three years, transforming its operational efficiency and decision-making capabilities.
Life sciences
Pharmaceutical firms depend on visual data wrangling to meet regulatory demands and accelerate drug discovery. Similarly, healthcare organizations use visual data wrangling in myriad different ways. In healthcare and life sciences, data volumes are exploding—from genomics to electronic health records. Visual data wrangling allows researchers, clinicians, and operations teams to combine disparate datasets for faster, more precise insights.
Case in point: National University Health System (NUHS), Singapore. Facing rising healthcare demands and an aging population, NUHS sought to move beyond hospital-based care into preventive, community-driven healthcare. By implementing Spotfire as part of its ENDEAVOUR AI platform, NUHS operationalized real-time streaming data and predictive AI models across its entire health system. Visual data wrangling played a critical role in aggregating diverse clinical, demographic, and lab datasets for rapid analysis and smarter intervention. As Dr. Ngiam Kee Yuan, Group Chief Technology Officer at NUHS, shared: "Spotfire technology enables the NUHS ENDEAVOUR AI platform to stream data in real time, feeding live data into AI models that produce actionable insights on the fly."
This transformation helped NUHS boost disease screening, optimize hospital operations, and pioneer new healthcare AI models, all while preparing for the future of preventive and precision medicine.
Financial services
In financial services, real-time insights and predictive accuracy can make or break profitability. Visual data wrangling equips teams to unify customer, transaction, and risk data, enabling smarter segmentation, fraud detection, and pricing strategies.
Case in point: AA Ireland. With mounting losses in the insurance market, AA Ireland needed a better way to understand customer segments, optimize pricing, and predict profitability. Spotfire provided the answer. By putting powerful analytics and real-time data wrangling tools into the hands of business users, not just data scientists, AA Ireland built and deployed predictive models in a fraction of the time. In just three months, the analytics team built its first live model, accelerating time to insight and empowering users across the organization. As Colm Carey, Chief Analytics Officer, put it: "You don’t sit in an IT queue for a year and a half. You build a model yourself and generate a lot of revenue for the company. It’s that power."
With Spotfire, AA Ireland achieved a 22 percent revenue increase through smarter price optimization, fraud detection, and customer value modeling—all powered by real-time data and intuitive visual workflows.
Best practices for visual data wrangling
Getting the most out of visual data wrangling involves more than just clicking and dragging your way through a dataset. The process works best when guided by a few well-established principles that balance exploration, precision, and auditability.
Understand your data first
Before diving into transformations, understand what you're working with. In Spotfire, automatic data profiling gives you a visual snapshot of column types, missing values, and distributions. This insight helps identify issues like outliers, duplicate rows, or incomplete records that might skew analysis down the line.
Experiment safely
One of the biggest advantages of visual wrangling is the ability to try, test, and undo. You don't need to get it right on the first try. Apply a filter or a pivot, check the preview, and refine it. Real-time previews in Spotfire make it safe to experiment without losing track of your data’s integrity.
Track and revisit each step
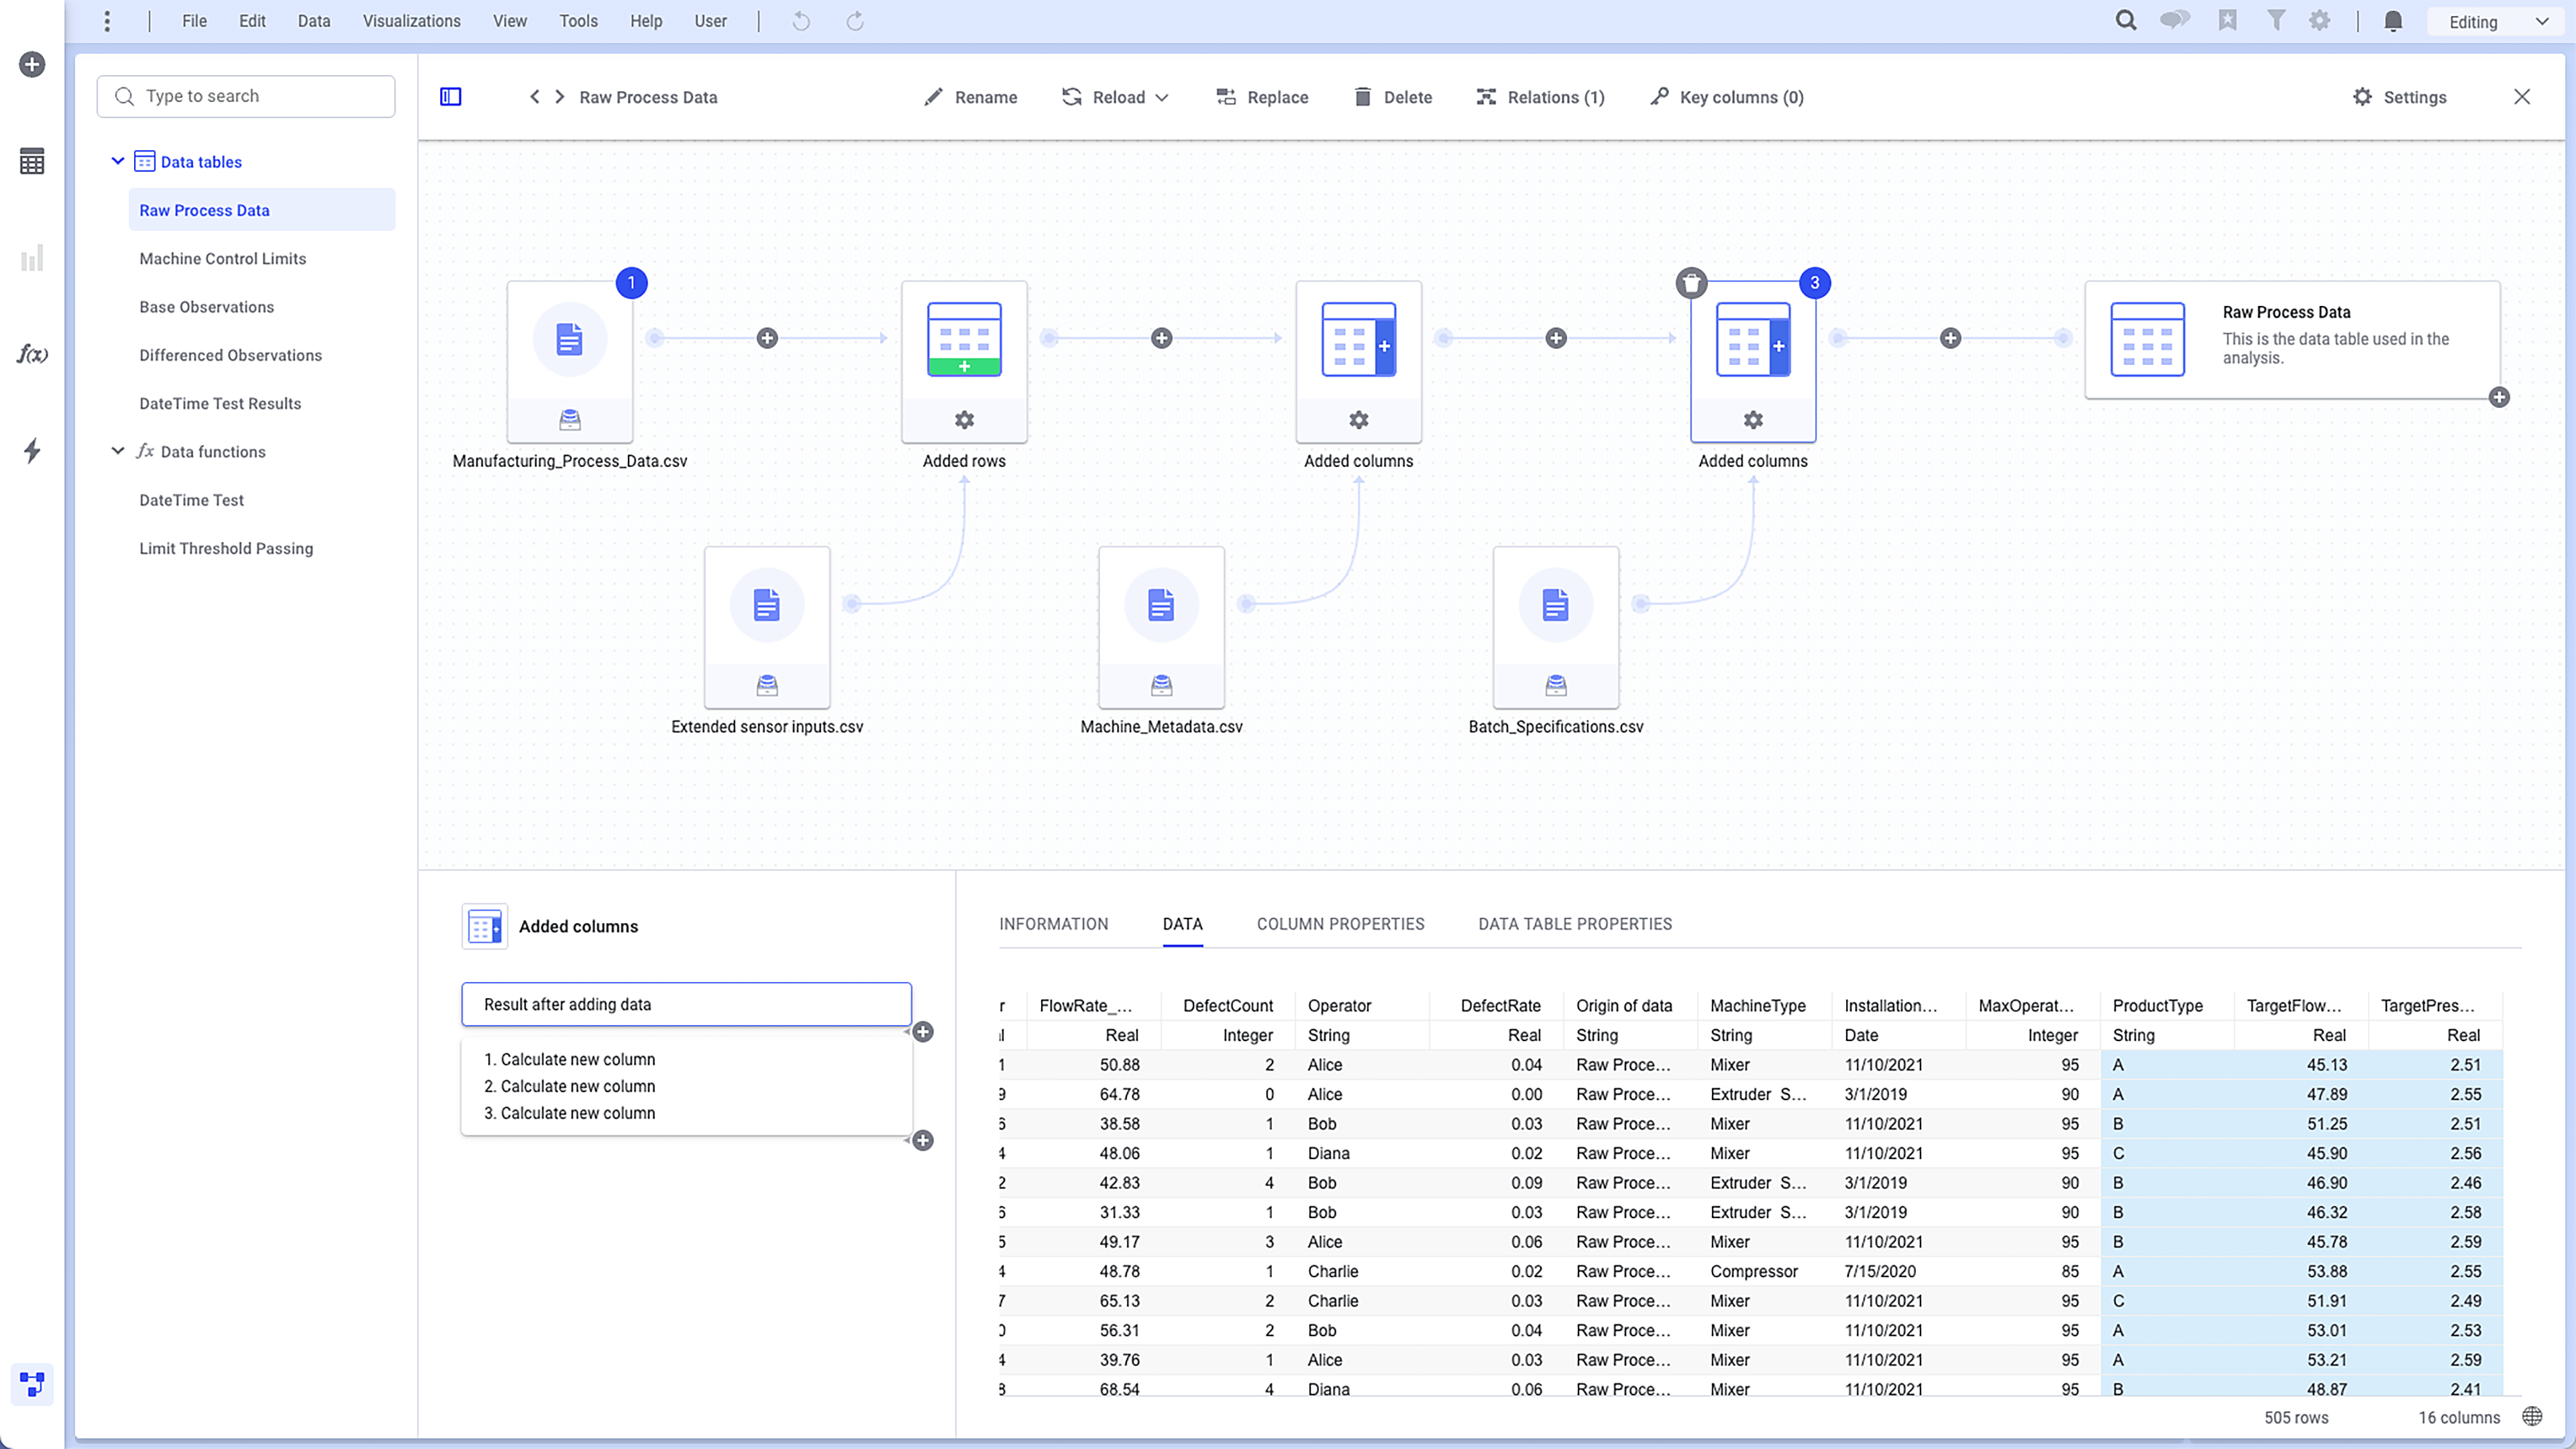
Every transformation step appears in the Spotfire Data Canvas as a node in your workflow. This keeps you organized and allows teams to review and audit changes. It’s especially important in regulated industries or enterprise environments where transparency and repeatability are non-negotiable.
Embrace AI-powered suggestions, but use your judgment
Spotfire offers automated transformation suggestions—like cleaning operations or intelligent joins—which save time and reduce manual work. But just because a join is suggested doesn’t mean it’s correct for your business question. Domain expertise still plays a vital role in validation.
Preview and validate early and often
Live previews let you confirm that each transformation does exactly what you intended. Rather than waiting until the visualization or analysis stages to catch issues, you can validate at each step, reducing rework and increasing trust in your results.
Practical steps to implement visual data wrangling in Spotfire
Using intuitive visual tools, here’s how you can start wrangling your data today in Spotfire:
Step 1: Visualize first
Start with visualizations to gain an initial understanding of your data.
Step 2: Leverage AI recommendations
Use AI-driven suggestions for visualizations and data cleansing to accelerate understanding and efficiency.
Step 3: Discover issues
Use box plots, scatter plots, and histograms to identify outliers or data quality issues.
Step 4: Transform dynamically
Based on observations, blend, transform, and augment data directly within the analytical context.
Step 5: Refine and iterate
Continuously adjust and refine your data as new insights emerge from the visualizations.
Step 6: Deepen analysis
Drill down, explore correlated details, and investigate root causes.
Step 7: Track and manage in Data Canvas
Use the Data Canvas to visually manage your data flow, ensure non-destructive operations, and maintain data provenance.
What are the benefits of visual data wrangling?
Visual data wrangling makes life easier for data scientists and analysts, but it also fundamentally transforms how data preparation contributes to decision-making at scale.
Accelerated time to insight
When you eliminate the need for coding, you remove a significant bottleneck in the analytics pipeline. Non-technical domain experts can prepare their data without waiting on IT, dramatically reducing the time between question and answer.
Anyone can wrangle data
With visual tools, data wrangling becomes accessible to a much broader set of users. Engineers, product managers, and operations leads can all work with data directly, leading to better-informed decisions across the business.
Enhanced transparency and governance
The Spotfire Data Canvas provides a visual, auditable log of every transformation applied to a dataset. This makes it easier to comply with internal policies, regulatory requirements, and collaborative processes without mystery scripts or undocumented changes.
Domain experts shape their own data
Visual data wrangling democratizes data preparation. It enables experts in their field, whether they’re analyzing oil fields, semiconductor yields, or clinical trial results, to shape data on their terms. With Spotfire, they can bring their domain knowledge directly into the wrangling process without learning a new programming language.
Ready to see visual data wrangling in action?
Watch our visual data wrangling webinar to explore how Spotfire transforms complex data into insights—visually.
Related resources
Go beyond traditional data prep. Discover insights through dynamic interaction with Spotfire.
Preparing data for analysis doesn’t have to be painful. Clean, shape, and transform data visually with Spotfire, no code required.