What is business intelligence?
Business intelligence (BI) includes the applications, infrastructure, tools, and best practices that enable access to and analysis of information to improve and optimize decisions and performance.
Organizations want timely, well-informed decision-making, in operational settings and in the corner office—no matter what their mix of platforms, applications, or infrastructure environments. A modular, scalable, standards-based business intelligence solution architecture can be easily deployed in any environment for delivering services across the enterprise.
Business intelligence enables data visualizations or graphical depictions that help people see and understand data faster and more effectively. Interactive (clickable) data visualizations support drilling down to explore details, identify patterns and outliers, and change which data is processed and/or excluded. When data is visualized, it's easier to identify emerging trends, the very first step in deriving insight.
Features of business intelligence
Reporting
With business intelligence reporting software that takes information from one or more data sources and presents it in an easy-to-read format, business users can stay informed and get answers to questions asked at regular intervals. They can design rich, interactive, pixel perfect dashboards and scale to thousands of users, as well as ad hoc reports for the web, print, or mobile device.
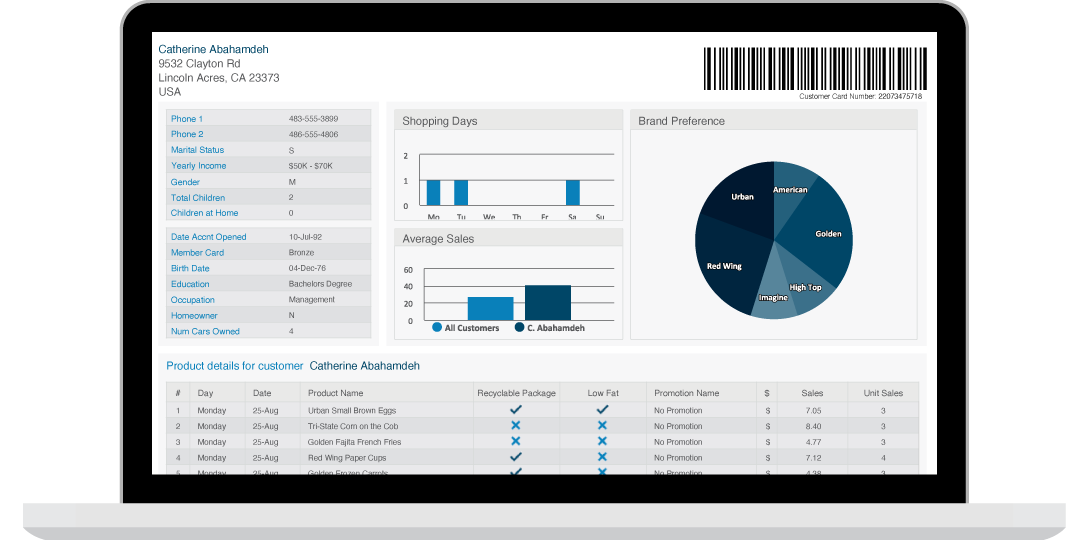
Analysis
With data analysis software designed to model, visualize, and manipulate any type of data and support better decision-making, users can spot trends, identify issues, and generate insights. They can explore data with powerful relational OLAP or in-memory analysis against any data source.
Dashboards
With dashboards that combine data and graphical indicators and deliver at-a-glance summaries, users can view the state of business, track key performance indicators (KPIs), generate insight into historical and real-time context, and act faster. When software developers embed these dashboards within applications where executives and knowledge workers are taking action, they make their products more valuable and competitive.
Data integration
A data mart or warehouse can be built with data integration software that extracts, transforms, and loads (ETL) data from different sources for reporting and analysis purposes. Several disparate relational or non-relational data sources can also be combined and made quickly accessible using data virtualization technology.
Benefits of business intelligence platforms
Faster insights
Empower everyone to transform data into insights quickly and easily. Data visualization allows easy discovery of trends and faster identification of outliers. The information helps build an understanding of how business is performing and what opportunities and risks are developing.
Smarter, faster decisions
Organizations can make fast data-driven decisions. Because understanding information and collaborating with others to spark insights from it is now a much faster, fact-based process, the days of relying on gut instinct to make decisions are long gone.
Greater value from products and services
Data holds an incredible amount of value, yet most users don't have the time or patience to learn a specialized business intelligence tool. Organizations can make data access convenient and data analytics intuitive for users by embedding self-service analytics in apps and business processes.
Easier analytics for all
Today, technical teams can be saved from the time and effort of writing custom code for every report or visualization. Instead, they can now enable end-users to visualize and get answers from data all on their own.
Top capabilities of business intelligence platforms
Business intelligence solutions are delivered via business intelligence platforms, which offer security and auditing services, a metadata layer, and multi-tenancy.
Authoring & design tools
- Database connectors and drivers for connecting to data sources. Some business intelligence tools offer the ability to define custom data sources.
- Wide range of visualization types including interactive HTML5 charts, maps, and support for using custom visualizations to construct reports and dashboards.
- Support for expressions to control the look and behavior of data, text elements, chart properties, hyperlinks, images, and more.
- Optional self-service, drag-and-drop design environment for business users with little to no technical skills.
Security and auditing services
- Central repository for securing reports, dashboards, and analysis views
- Secure access to reports and analytics down to the row and cell level
- Audit and monitoring services for diagnostics, compliance, and performance metrics
- Single sign-on (SSO) support with a customizable API to simplify the integration and configuration with third-party identity management solutions
Metadata layer
- Business-friendly fields representing relational or non-relational data
- Filters and security rules at the metadata layer
- Combining of multiple data sources in a single metadata view without ETL or data warehouse tools
Multi-tenancy
- Web service-based platform accessible using Java, XML, HTTP protocols
- CSS based user interface for customizations, device and tenant-specific UIs, and corporate re-branding
- ata source extensibility for integrating with relational, olaP, and big data sources
Distribution
- Export to various file types (PDF, XLSX, PNG, DOCX, PPT, JSON, XML…)
- Scheduler to designate time and rules-based distribution of reports, dashboards, and other analytic content
- JavaScript API to support seamless embedding into web pages and applications
- iFrames to support simple embedding into applications and web pages via HTTP
- Mobile SDKs to facilitate integration of BI into mobile applications
Types of business intelligence
Static reporting
This form of business intelligence reporting is used to provide a fixed view of data from operational data stores. Some reports are formatted and ready to print, while others are available to download as a Microsoft Excel worksheet or other format. Static business intelligence reports provide a view in time, typically coming from the live operational database within the application. This type of reporting is primarily used for reports where there is a pre-determined layout such as invoices, statements, and periodical updates.
Managed interactive reporting
The success of an operational application often leads to new business requirements and new challenges for the group managing the application. In this type of business intelligence reporting, the end user controls chart types, filters, and formatting. It is mainly used for dynamic lists, and filtering results and conditional highlighting. Managed business intelligence reports help drive business performance with information sharing and pre-defined key performance indicators (KPIs).
Highly interactive reports and dashboards
While the reports described above provide detailed application information for daily tactical decisions by line managers and shop floor users, they may not suit executives or line of business managers. Executives may not need operational applications daily, but instead weekly, daily, or hourly snapshots of business performance and process tracking. A business intelligence performance dashboard measures short- and long-term trends with quick access to underlying details to help managers react based on KPIs and highly graphical metrics.
Self-service reporting for operational applications
This report feature allows you to create custom business intelligence reports for various operations outside of a packaged operational application. The user has two options. They can receive direct database access to the operational application schema and pull a CSV file of the data to their local machine, or use a report design tool for more advanced requirements. The second option is an easy-to-use report design environment for ad hoc reporting and analysis. Users can define an easy-to-understand semantic layer that sits on top of the application database. With these elements, and a graphical drag-and-drop report designer, users can build their own business intelligence reports on demand without needing additional support. Ultimately, this type of reporting empowers users to help themselves and others.
Self-service data exploration for deeper insight
With business intelligence, users can explore their data and spark deeper insight. As an example, a retailer might want to explore a variety of data dimensions including wholesale unit costs, retail price, inventory aging, shipping costs, and product promotion data. To do this, users can either build custom reports or use data exploration tools that let them intuitively find the data they need, and allow them to answer questions to their ad hoc queries.
