Demo gallery
Geoanalytics
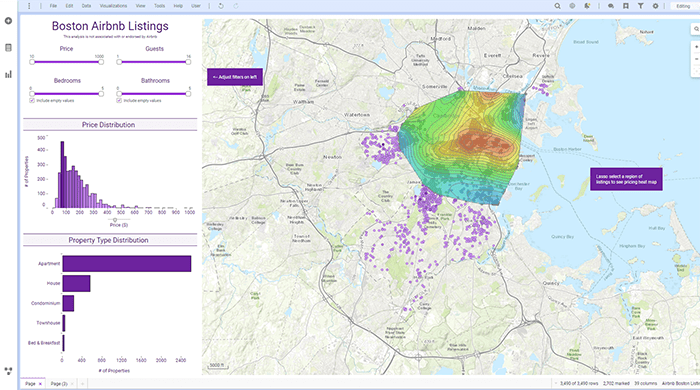
Boston Airbnb Explorer
Explore property locations in Boston with dynamic filtering options on an interactive map layer, enabling personalized searches and detailed exploration of Airbnb listings.
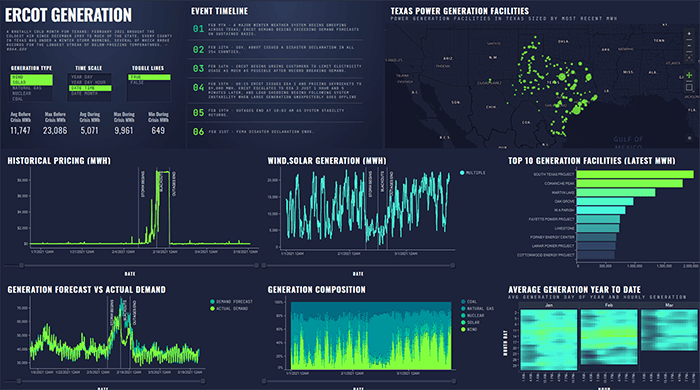
Grid Performance Explorer
Delve into energy demand and pricing using multi-layer geoanalytics with drilldown capabilities to uncover mission-critical insights and optimize grid performance.
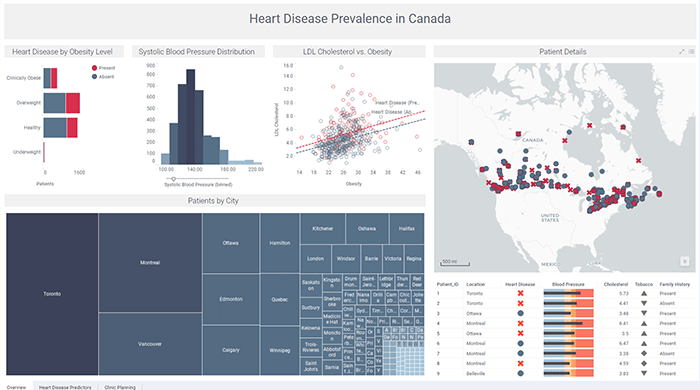
Heart Disease Prevalence
Explore patient data to examine heart disease prevalence and correlations with various risk factors, leading to the discovery of insights into effective prevention and treatment strategies.
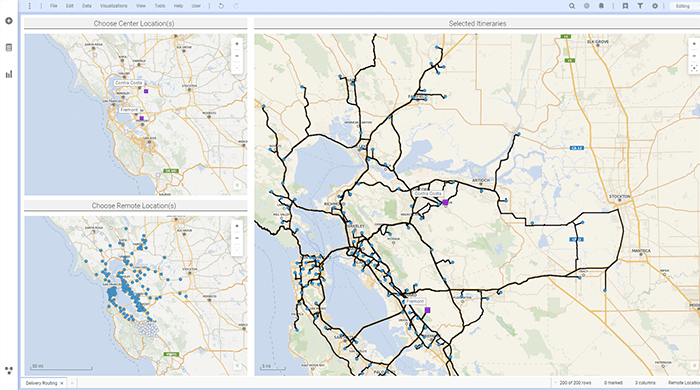
Delivery Routes in the Bay Area
Calculate optimal driving routes between distribution centers and delivery destinations across the Bay Area, and ensure efficient logistics and timely deliveries.
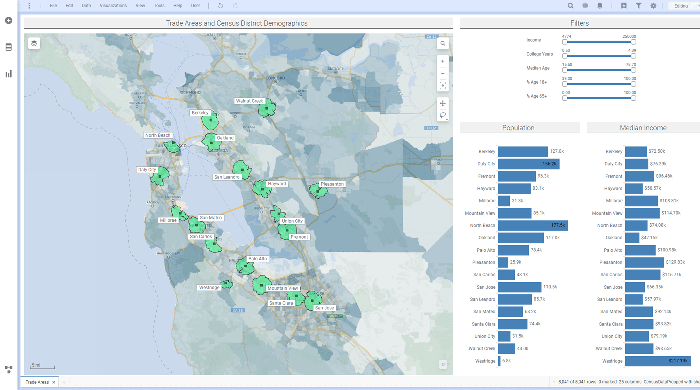
Drive Areas
Analyze the intersection of location and demographic geometry layers to optimize market targeting and understand customer behavior patterns in specific geographic areas.
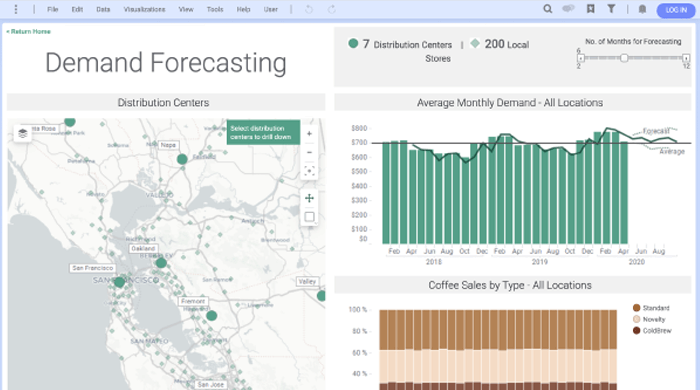
SpotCoffee Demand Forecasting and Route Optimization
Enhance revenue from product sales and reduce operational costs by accurately forecasting demand for SpotCoffee products and optimizing delivery routes to maximize profitability through streamlined operations.
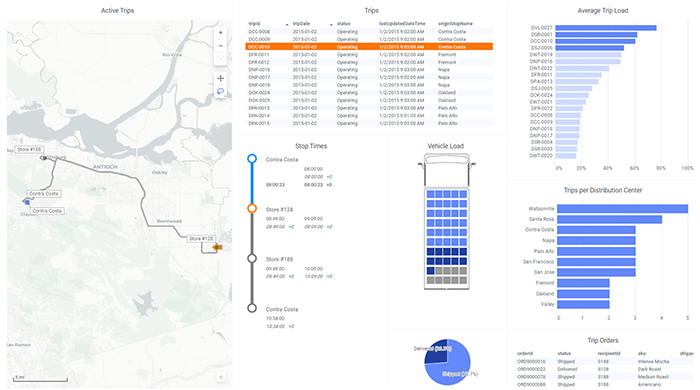
Vehicle Loading and Delivery Logistics
Monitor real-time cargo unloading and dynamically recalculate route optimization to ensure efficient delivery logistics and timely transportation management.
Predictive analytics
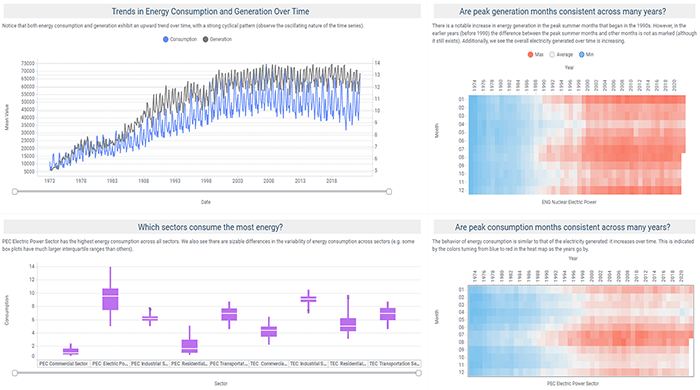
Forecasting Energy Consumption and Generation
Accurately predict future energy demand and generation by analyzing historical data, environmental factors, and other relevant variables to optimize energy management and planning.
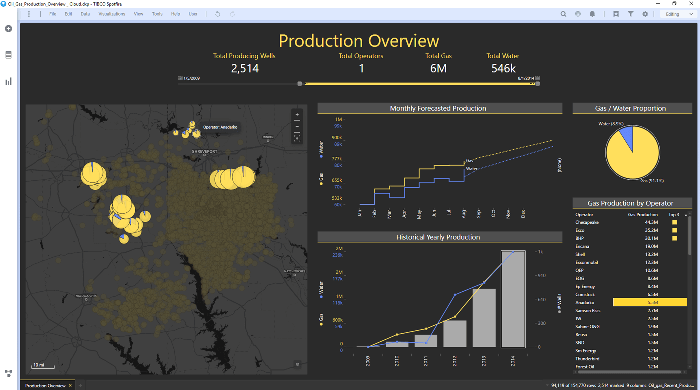
Oil & Gas Production Overview
Explore and analyze historical gas production data from Texas wells, allowing for a detailed examination, as well as trend identification to optimize operations.
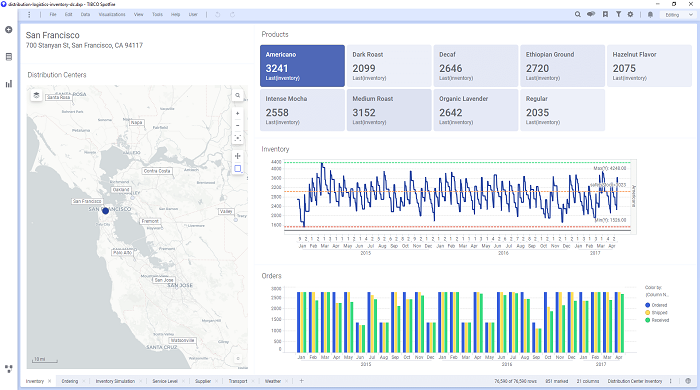
Supply Chain Inventory for Distribution Centers
Analyze inventory levels across distribution centers and retail stores for various SKUs. The demo also includes Economic Order Quantity and Safety Stock modeling to optimize inventory levels, as well as Inventory Simulation for forecasting and managing stock during promotions.
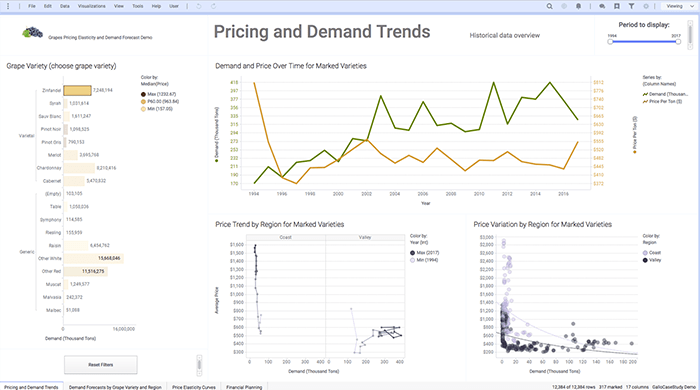
Price Elasticity with Wine Grapes
Interactively calculate and visualize price elasticity curves to understand market dynamics and optimize pricing strategies for wine grapes.
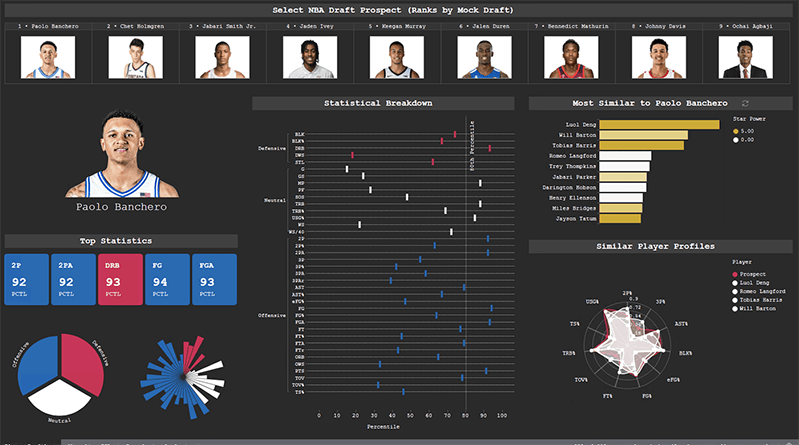
Pro Basketball Draft Analyzer
Analyze player data, compare skill sets, and discover which basketball prospects have the potential to follow in the footsteps of established NBA stars.
Anomaly detection
Wafer Scratch Detection
Quickly identify wafer scratches for yield optimization in semiconductor manufacturing. Leverage advanced techniques, and highlight scratches across multiple wafer lots, providing actionable insights to improve production efficiency.
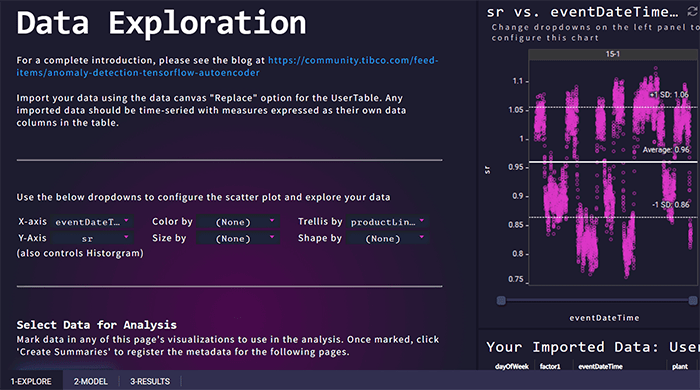
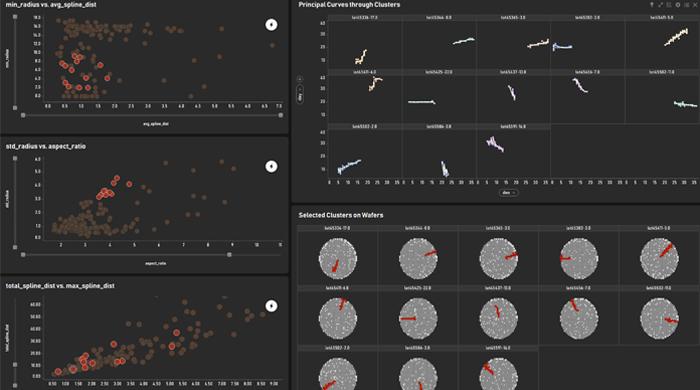
Anomaly Detection for Time Series Data
Identify and cluster anomalies in multivariate time series data, to detect irregular patterns or outliers that could indicate significant events or potential issues.
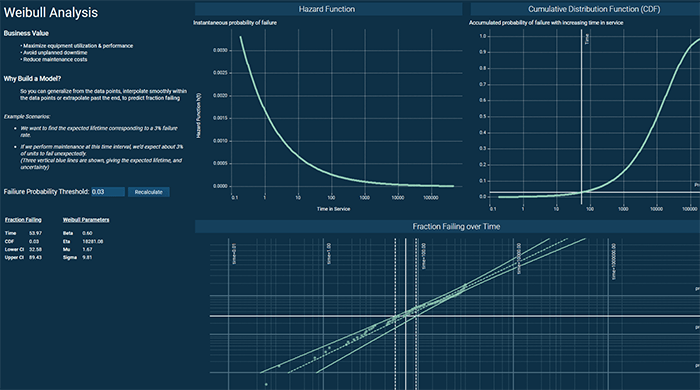
Predictive Maintenance with Weibull Curves
Make use of a parametric failure model with Weibull curve distribution to predict equipment failures, optimize maintenance schedules, and extend asset lifespan.
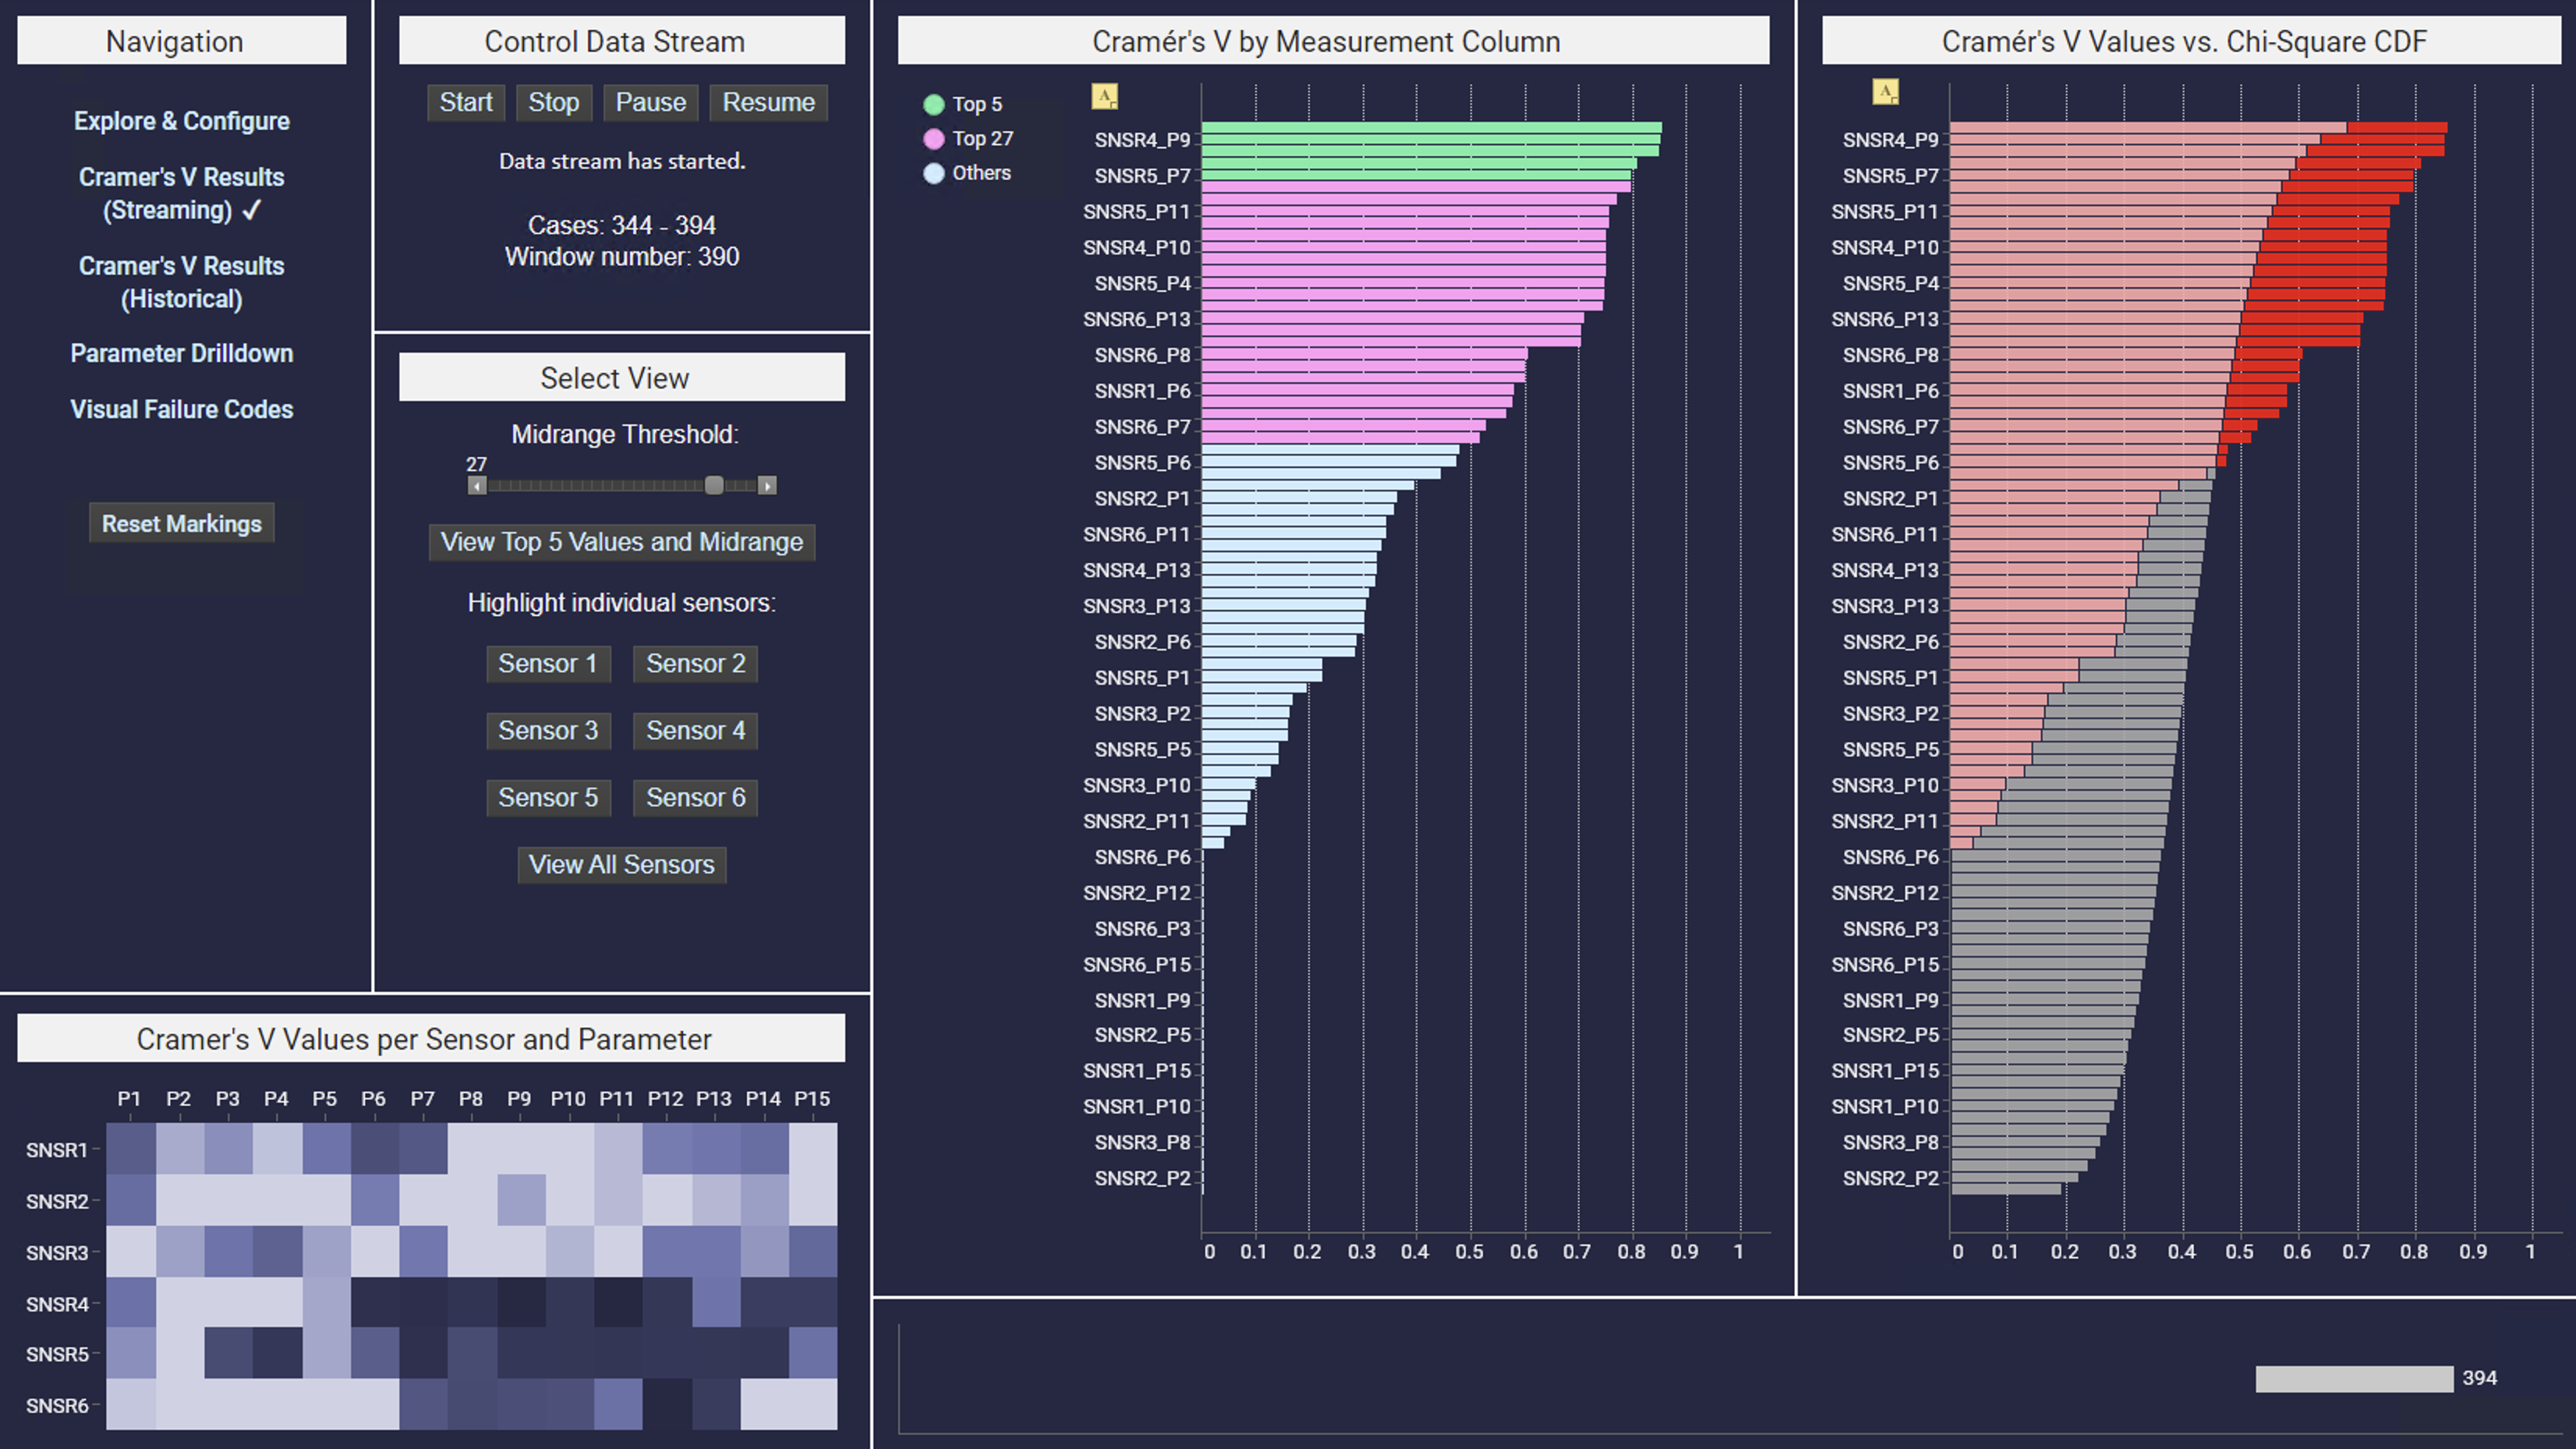
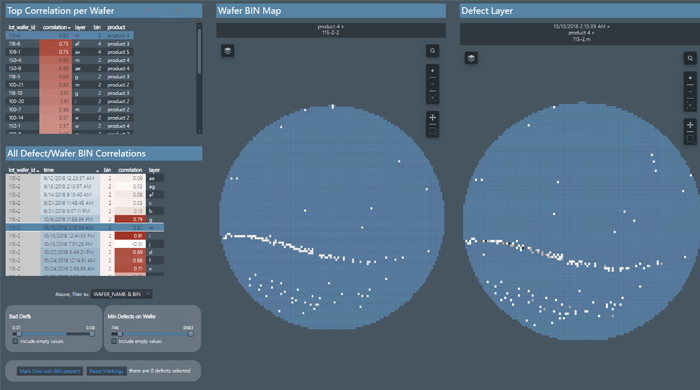
Wafer Test Measurement Correlation Analysis
Measure the correlation between streamed test measurements and a chosen target variable for wafers. Identify the sensors and parameters most associated with wafer test failures, provide actionable insights for troubleshooting to improve wafer testing processes.
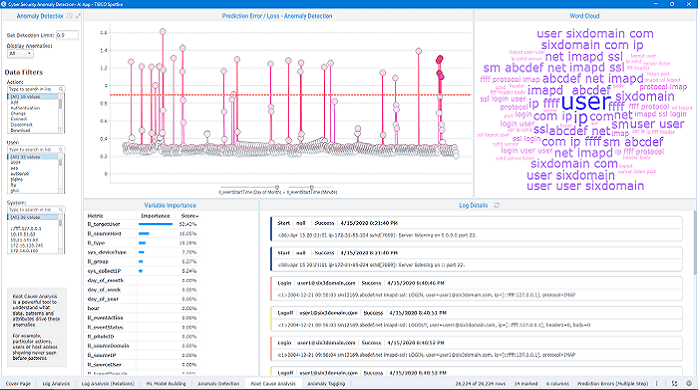
Cyber Security Anomaly Detection
Leverage Python, deep learning models, and interactive data exploration in Spotfire to identify and investigate anomalies in log data, and uncover complex cyber threats.
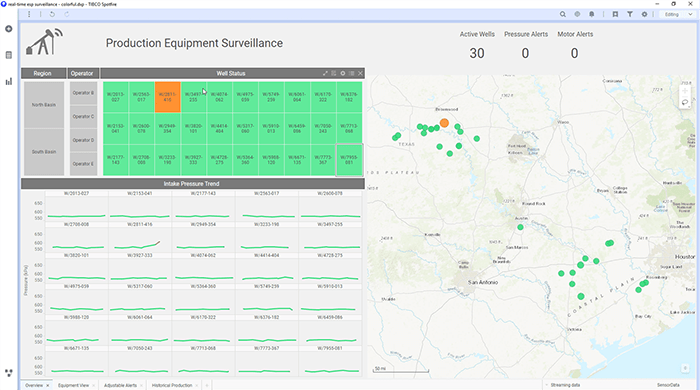
Oil Well Equipment Surveillance and Monitoring
Monitor wells for pressure spikes and current drops, enabling to make real-time adjustments to alert settings to further enhance equipment safety and performance.
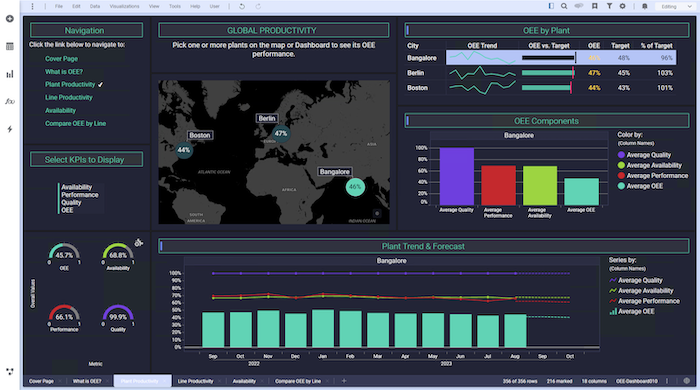
Plant Productivity
Monitor Overall Equipment Effectiveness (OEE) to optimize plant efficiency and minimize unscheduled downtime, ensuring smooth operations and increased productivity.
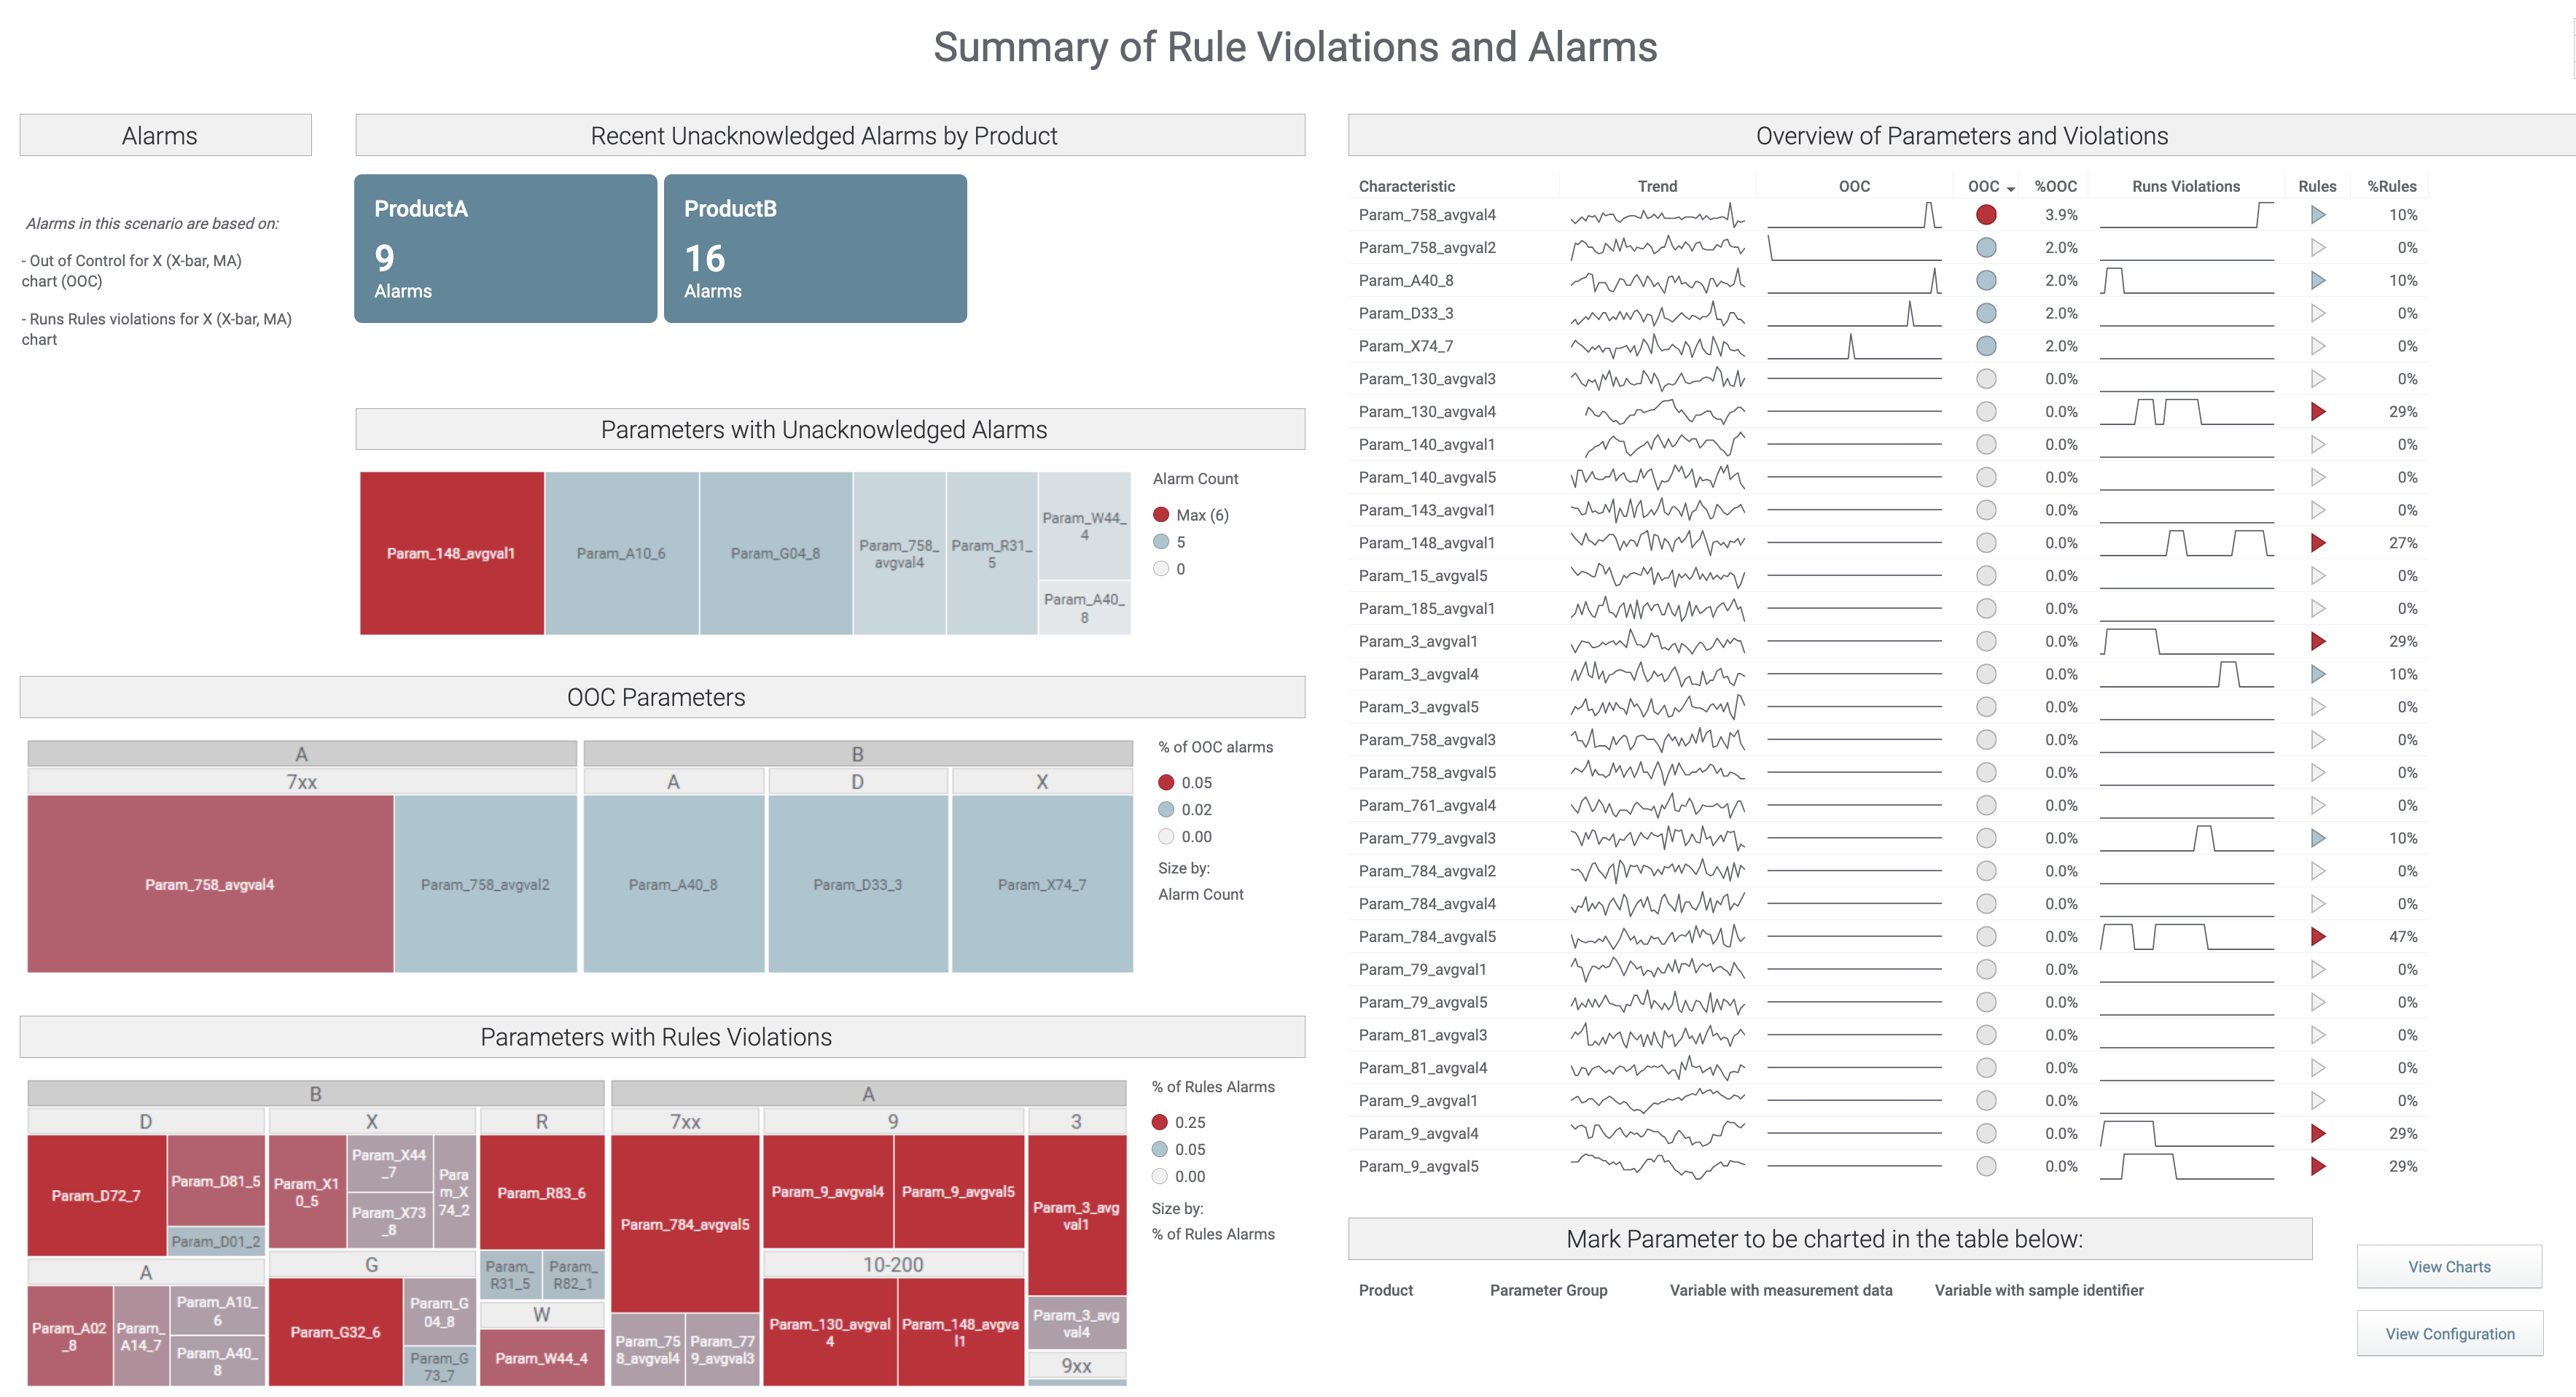
Statistical Process Control Monitoring
Monitor and analyze a wide range of parameters using Statistical Process Control techniques to ensure quality, detect anomalies, and maintain process efficiency.
Wafer Defect Analysis
Conduct root cause analysis by comparing patterns on wafers, facilitating the identification of composite patterns in industrial wafer maps for enhanced quality control and manufacturing efficiency.
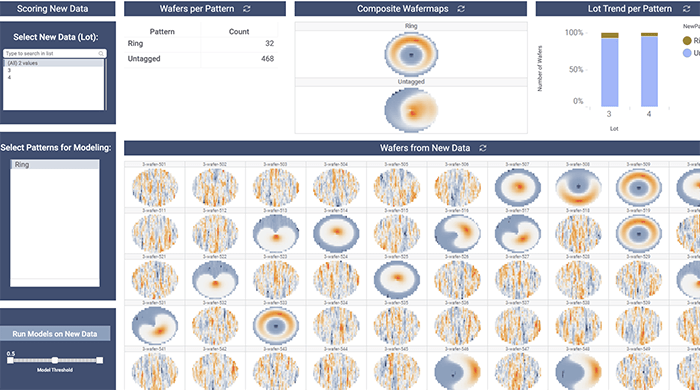
Wafermap Pattern Recognition
Discover and analyze composite patterns in industrial wafermaps using advanced pattern recognition techniques in Spotfire. Detect and interpret complex patterns to improve manufacturing quality and yield.

Wind Turbine Root Cause Failure Analysis
Identify anomalies in turbine performance and investigate the root causes behind them.

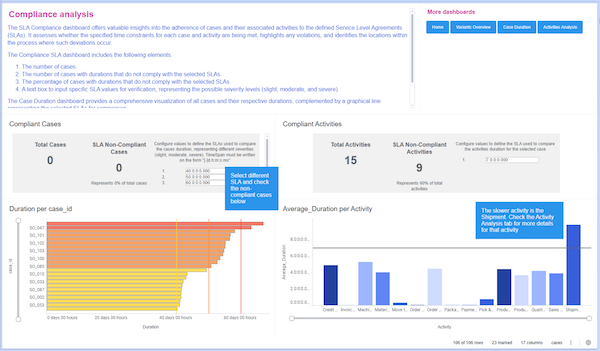
Intelligent Process Mining
See how Spotfire turns complex event data into clear process insights, revealing bottlenecks, deviations, and improvement opportunities.
Visual data wrangling and exploration
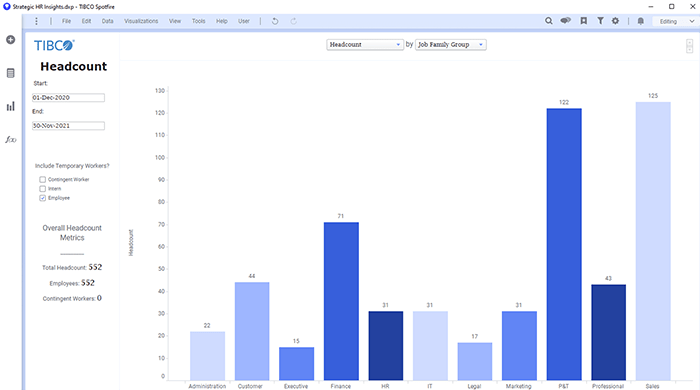
People Analytics
Dive into comprehensive HR data from Workday to analyze employee trends, performance metrics, and workforce demographics, empowering strategic decision-making and enhancing talent management.
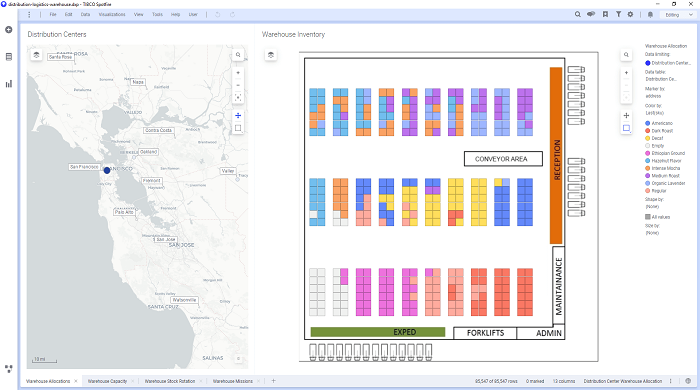
Supply Chain for Warehouse
Visualize a warehouse layout with stock allocations, capacity, and rotation data. Enable to facilitation of efficient receiving and storage of incoming stock, as well as timely dispatch of stock to stores, optimizing inventory management and operational flow.
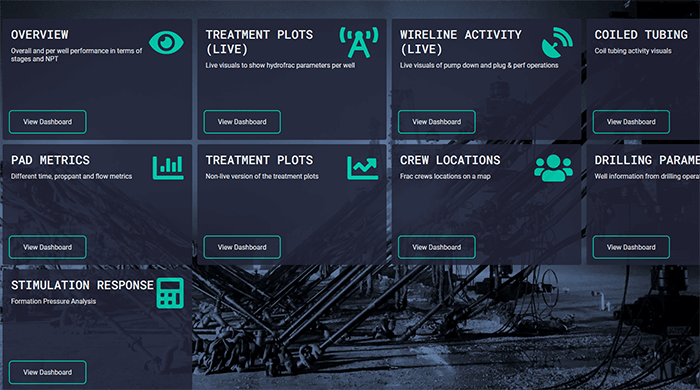
Well Completion Surveillance
In this environment, you'll be able to monitor and analyze real-time completion data streamed live from a well pad, ensuring efficient operations and timely decision-making during the completion process.
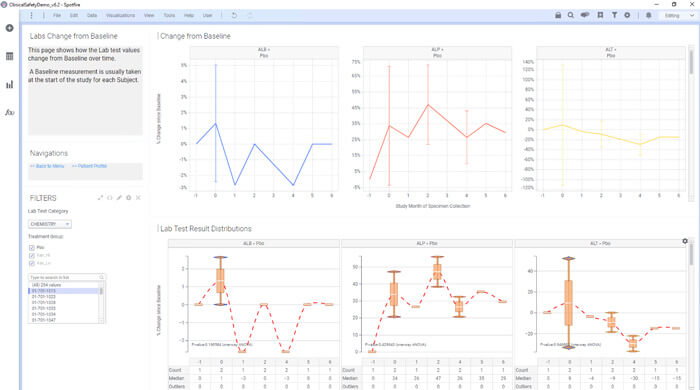
Clinical Study Safety
Enable thorough analysis of patient data, from demographics to adverse events and lab results, across Clinical R&D teams. Enable data-driven decision-making throughout clinical trials, supporting a smoother path to regulatory approvals.
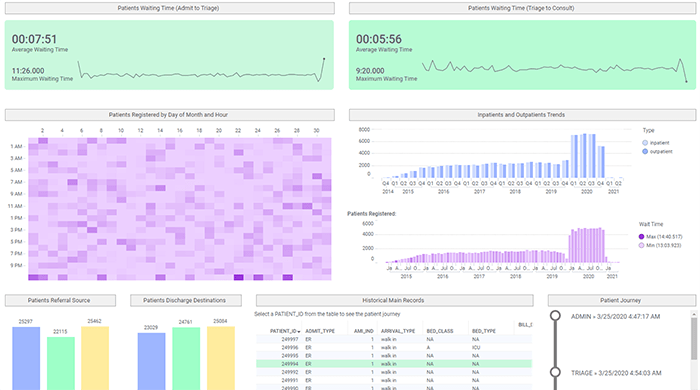
Hospital Management
Analyze historical patient data with privacy protection to predict length of stay and assess re-admission risks, enabling the optimization of operational efficiency and patient care outcomes.
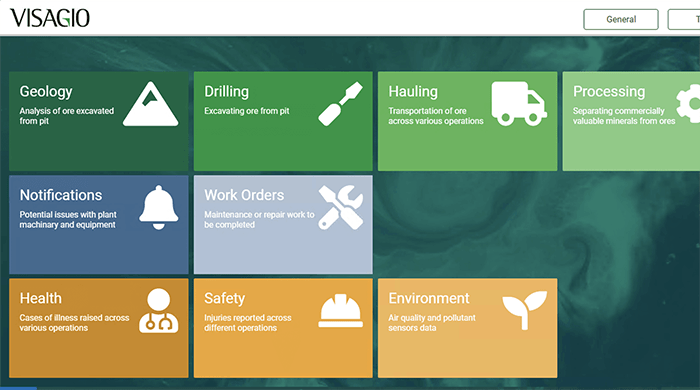
Intelligent Mining
Gather and analyze data at-rest and in-motion throughout the entire mining cycle to optimize operations from exploration to extraction, and processing, for enhanced efficiency and productivity.
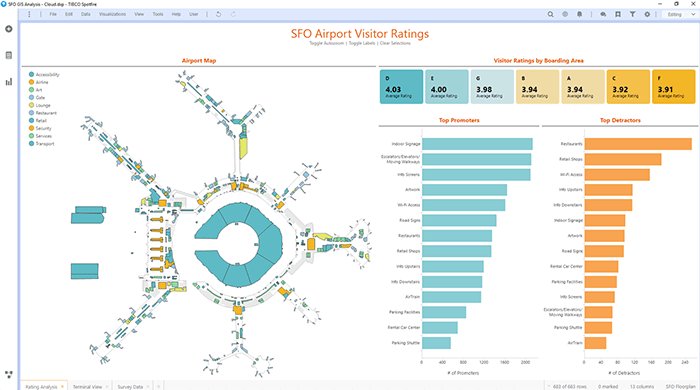
Visitor Ratings at SFO Airport
Visualize and explore visitor ratings to identify the best and worst amenities across San Francisco International Airport (SFO), aiding in informed decision-making and enhanced experiences for travelers.
Propensity modeling

Live Campaign Monitoring
Interact with dynamic dashboards to monitor real-time customer offers and campaign performance, to enable the adjusting of campaigns and maximize effectiveness.
Retail Customer Analytics
Generate actionable consumer insights through using interactive sliders, filters, and visualizations, to empower retailers to make informed decisions and enhance customer satisfaction and loyalty.