
If you’re in the Energy sector, you know that having precise visualizations for your equipment, fieldwork, and assets is crucial. That’s where Spotfire® Mods can assist. Mods are innovative “grab and go” custom visualization and analytics apps that leverage the power of Spotfire for a seamless, fit-for-purpose analytics experience. The Mods cloud-enabled framework makes it easy for anyone to build, share, and use. If you’re unfamiliar with Spotfire Mods, you can learn all about them from our recent TAF presentation where we show the power of Mods in action.
In this blog, we feature some of our top Mods for the Energy industry, specifically Oil and Gas use cases, which you can download on the Spotfire community.
Well Log Chart Mod
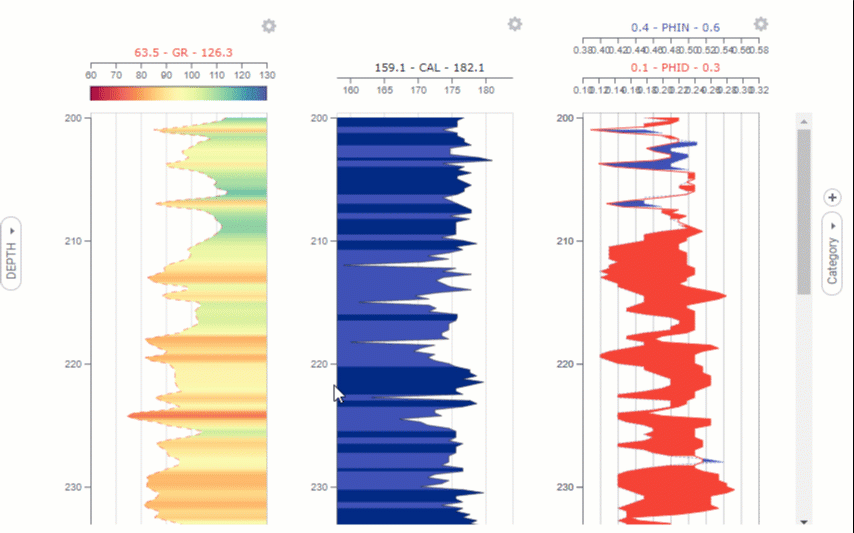
Well logs are mainly gathered from geologic formations penetrated by a borehole, but they can be used to visualize other similar data. Most often, well logs display measurements over the depth of one or more physical quantities in or around a well such as resistivity, porosity attributes, and lithology values. To visualize this well log data in Spotfire, you can use the Well Log Chart Mod.
You can download this Mod specifically on GitHub. Check out the Spotfire community to learn more.
Ternary Diagram Mod

A ternary plot is a barycentric plot on three variables that sum to a constant. It graphically depicts the ratios of the three variables as positions in an equilateral triangle. It is often used in physical chemistry, petrology, mineralogy, metallurgy, and other physical sciences to show the compositions of systems composed of three species.
With Spotfire, Ternary plots are an efficient and simple way to visualize and analyze data involving mixtures of three components. Use cases can range from simple data representation to identifying trends in multiple data points for use cases like:
- Gas analysis
- Crude oil analysis
- Fluid saturation analysis
- Phase behavior analysis
Download this Mod now or check out its related Spotfire community article to learn more.
List Mod

The List Mod can be used to display a selectable list of unique values in a column or a hierarchy. For example, you can use the List Mod in historian asset framework systems (i.e. AVEVA). The gif below shows how Spotfire can access PI Data, pull the underlying Asset Framework (AF) structure, and then visualize that using the Spotfire List Mod. Using the Mod, PI Data Archive querying can be as simple as selecting an element or element parent from the AF List Mod. The Spotfire PI Data Function will then reply back with data according to the data import parameters you set before.
Download this Mod or read more about it on the Spotfire community.
Timeline Mod
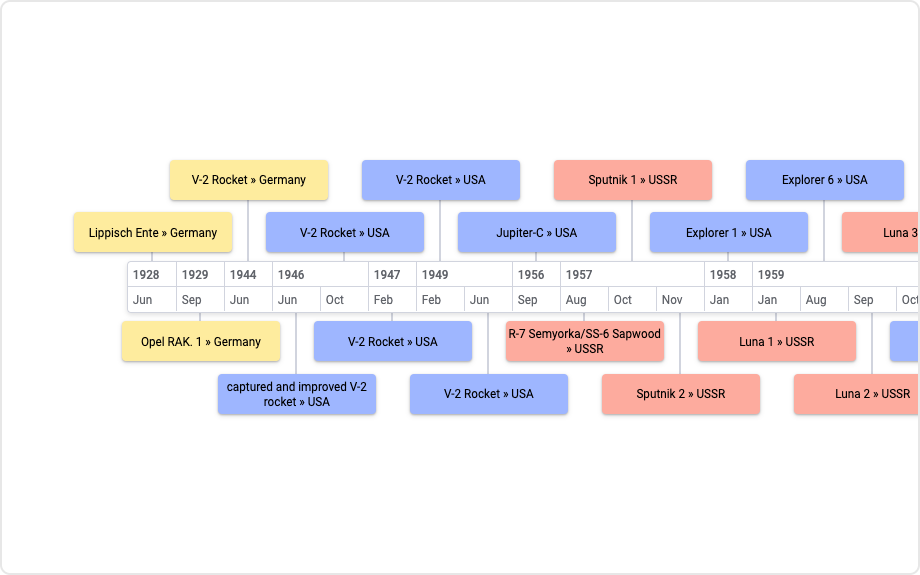
The Timeline Mod displays a list of events in chronological order. The main purpose is to communicate time-related information, over time, either for analysis or to visually present a story or view of history. A good use case is visualizing wellbore events during hydrofracking in both time and depth domains. This Mod is good for presenting any general sequence of events over time.
Download this Mod or read its article on the Spotfire community.
3D Scatter Plot Mod
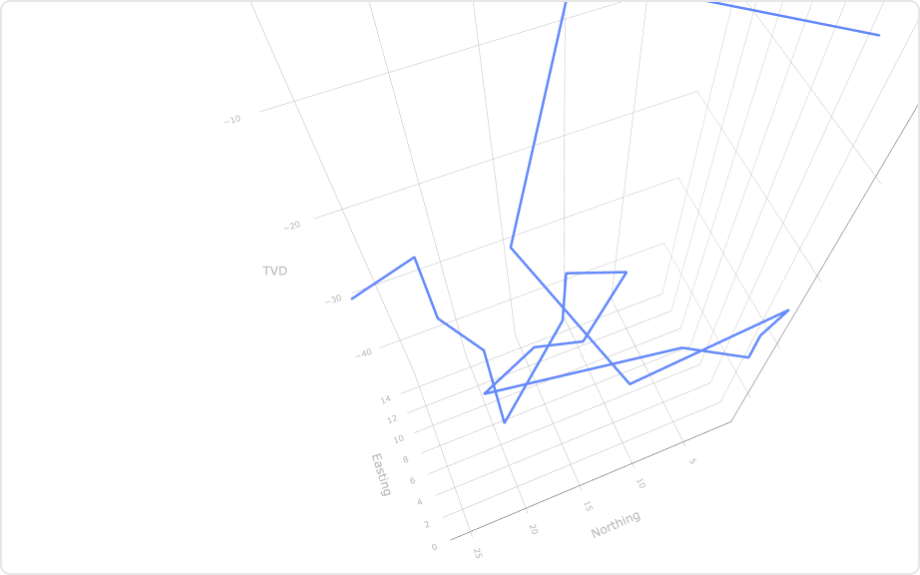
The 3D Scatter Plot Mod allows visualizing three variables in 3-dimensional space. The chart can be rotated in 3-dimensional space to re-orient the chart so that details can be observed. One particularly useful case in the energy industry for this chart is to visualize 3D well trajectories. Visualizing well trajectory helps to confirm that target pay zones were correctly reached with the required lateral length. In well completion, having a visual for the wellbore helps to track any pump or perforation jobs.
Download this Mod today or check out more information on the Spotfire community.
Get started with Spotfire® Mods
These aren’t the only Spotfire Mods available! Check out the Exchange on the Spotfire community to see all the Mods and other extensions like Apps, Accelerators, or Data Functions. For more resources, you can check out the Spotfire Mods Overview or Developer’s Hub. Happy customizing!