
The Spotfire Energy Forum 2025 featured some stellar sessions from Spotfire customers, partners, product managers, and thought leaders. The Forum focused on visual data science for the energy sector, and the many updates to Spotfire® Enterprise and Spotfire® Data Science, including:
- New Spotfire® visualizations for energy: Built-in Well Log, Wellbore, 3D surface/line analysis for subsurface visual data science
- New data science functions for time series and geospatial analysis in energy: Dynamic time/depth warping, smoothing, sampling, geospatial CRS, polygons, distances, and custom markers
- New Spotfire® Actions: Automation of configurations, data functions, visualizations, and data science workflows
Read on to discover some of the exciting sessions and speakers from the event.
Customer innovations in energy
The customer presentations were all excellent; examples from Liberty Energy and Occidental Petroleum, across exploration and production, are provided below.
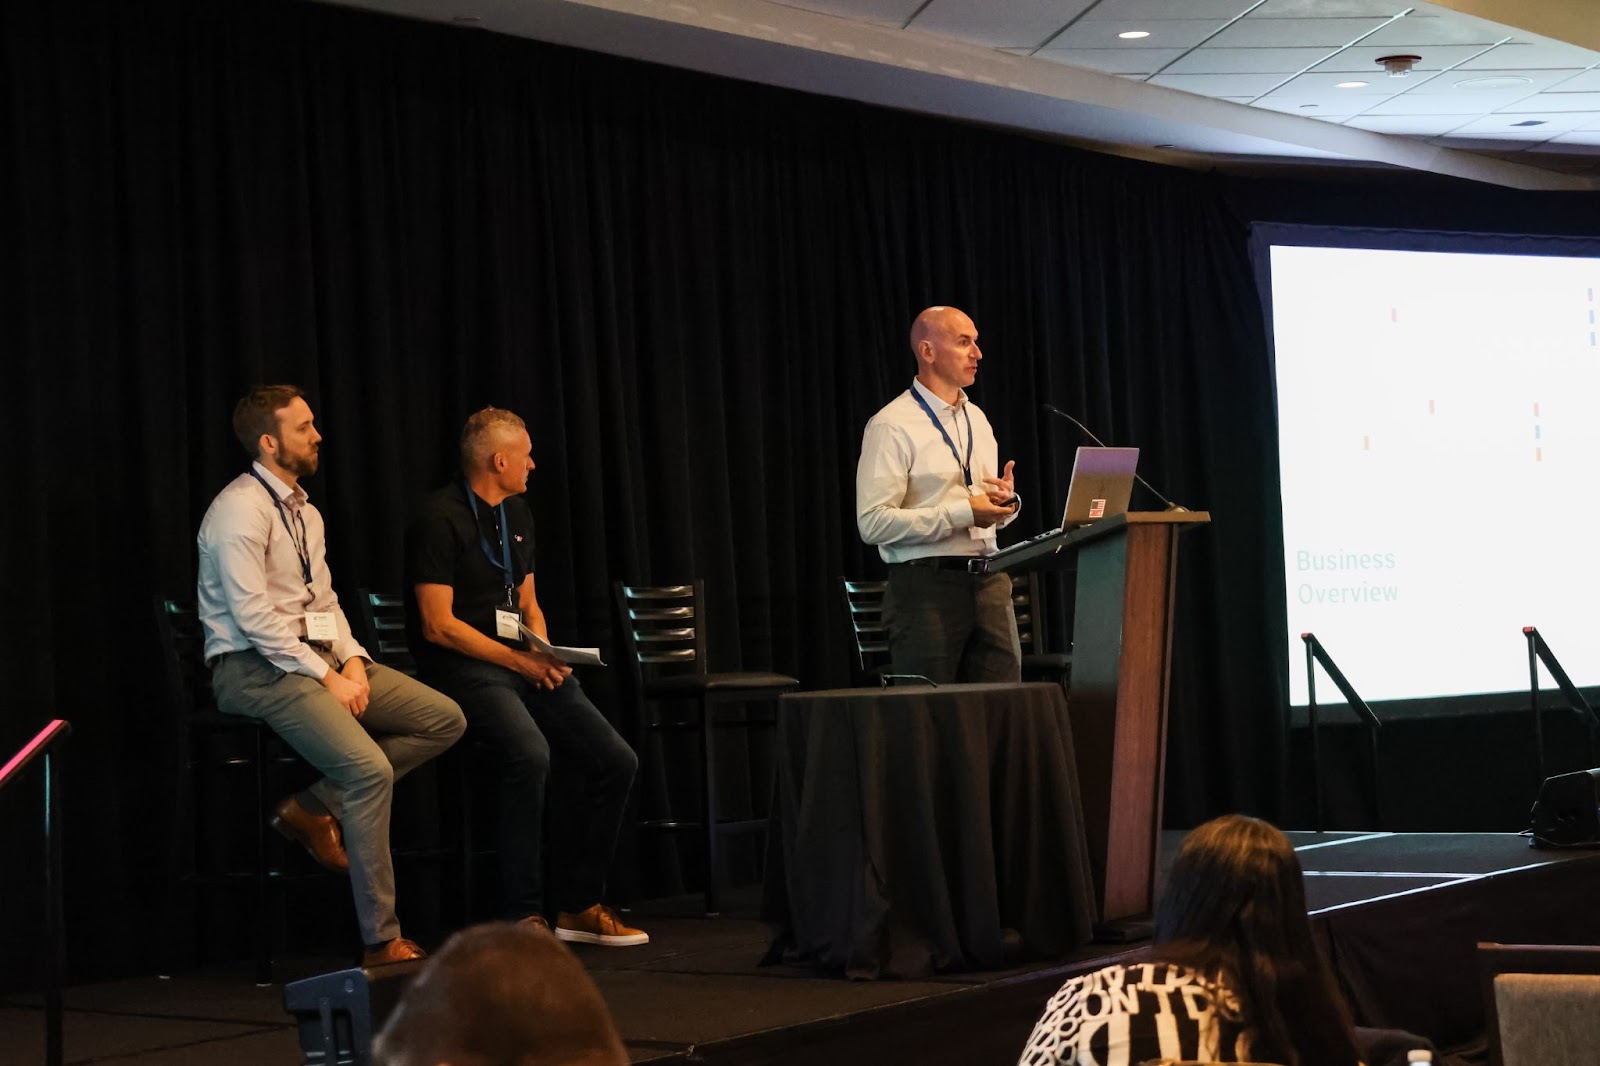
Liberty Energy: Leveraging Spotfire for operational excellence
David, Craig, and Justin showed a frac-to-wireline operations solution in Spotfire for completions, featuring a combination of real-time and at-rest data. This cloud-native, big data solution is impressive—managing multiple crews’ completions operations in real-time. Cory and I calculated 5.2e10 rows of data processed per month, from multiple well pads, crews, and frac jobs, through Spotfire. The deployment of Spotfire Copilot is impressive—with MongoDB as vector database, and the Copilot orchestrator and Liberty data loader in an EKS cluster on AWS. I’m looking forward to the combination of Liberty Energy content with Spotfire tokenized data for contextual insights across the vast amount of flowing operational data and visual data science methodologies.
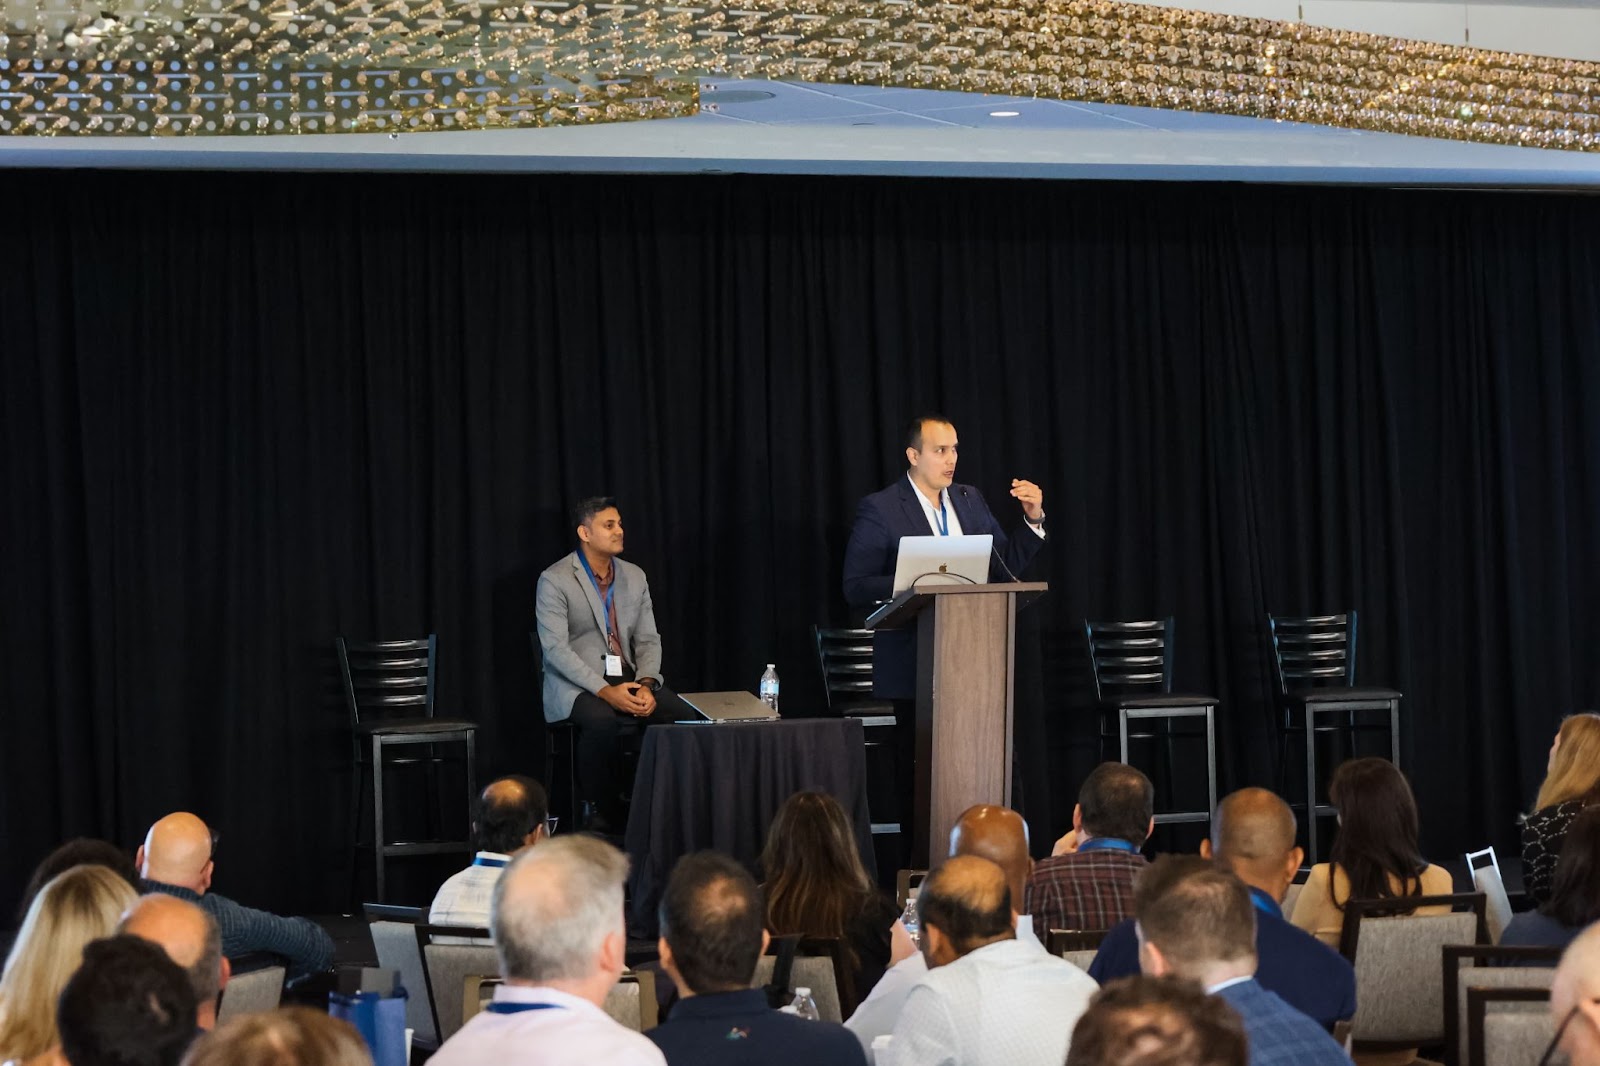
Optimizing production & surveillance at scale
Priyank and Mario presented two advanced Spotfire solutions from Oxy on production forecasting and management (Outlook Tool) and competitor surveillance (CST). Outlook is the go-to application and system of record for financial planning, capital allocation, development planning, and setting guidance for investors. The Competitor Surveillance tool combines Oxy, Enverus, and S&P Global data, with Spotfire seamlessly integrating SQL, Python, and Databricks to deliver insights on demand. The tailoring of Spotfire data functions, visualization modules, JavaScript, and HTML/CSS in creating these applications is super! I was also impressed with the multiple strategies for scaling—using cached information links, Databricks for heavy compute loads, and just-in-time compute strategies. These applications touch all functions—reservoir and production engineers, geologists, data scientists, and managers.
Updates from the Spotfire team
The Spotfire sessions were full of cool Spotfire applications across the Energy sector. I began with some highlights from the Spotfire® visual data science platform, showcasing its visual data science and GenAI tools across the energy sector. My Spotfire Copilot demo featured an interactive chat analysis for reading and analyzing well log data—including generating Spotfire data science functions, running these in the data canvas, and visualizing well log data via the new Spotfire UX, connecting in-product and community visualizations. I tied the resulting well log analysis to production data via interactive navigation from a Spotfire map interface.

I also showed how Spotfire connects and visualizes data, along with data science functions for geospatial and time series analysis, enabling operational solutions in exploration and production. I showed how Spotfire® Enterprise Advanced Data Services provides a data layer abstraction across multiple source systems for consistent ad-hoc analysis in a self-service setting. The combination of (a) developer solutions and (b) self-service ad-hoc analyses, enables rapid insights and actions across all engineers, scientists, and developers in the Energy sector.
I illustrated this flow with operations solutions featuring (a) the new Well Log analysis module, (b) real-time drilling, and (c) production surveillance. The Well Log analysis compares data for two wells (see below) along with well location, production profiles, and deviation surveys. The analysis shows significant additional production obtained in well A, and how this relates to the well log analysis. Well A is highly deviated with a longer section going through the reservoir. One can see this from the completion interval for well A showing more time spent in the hydrocarbon-rich Wilcox 1-4 layers.
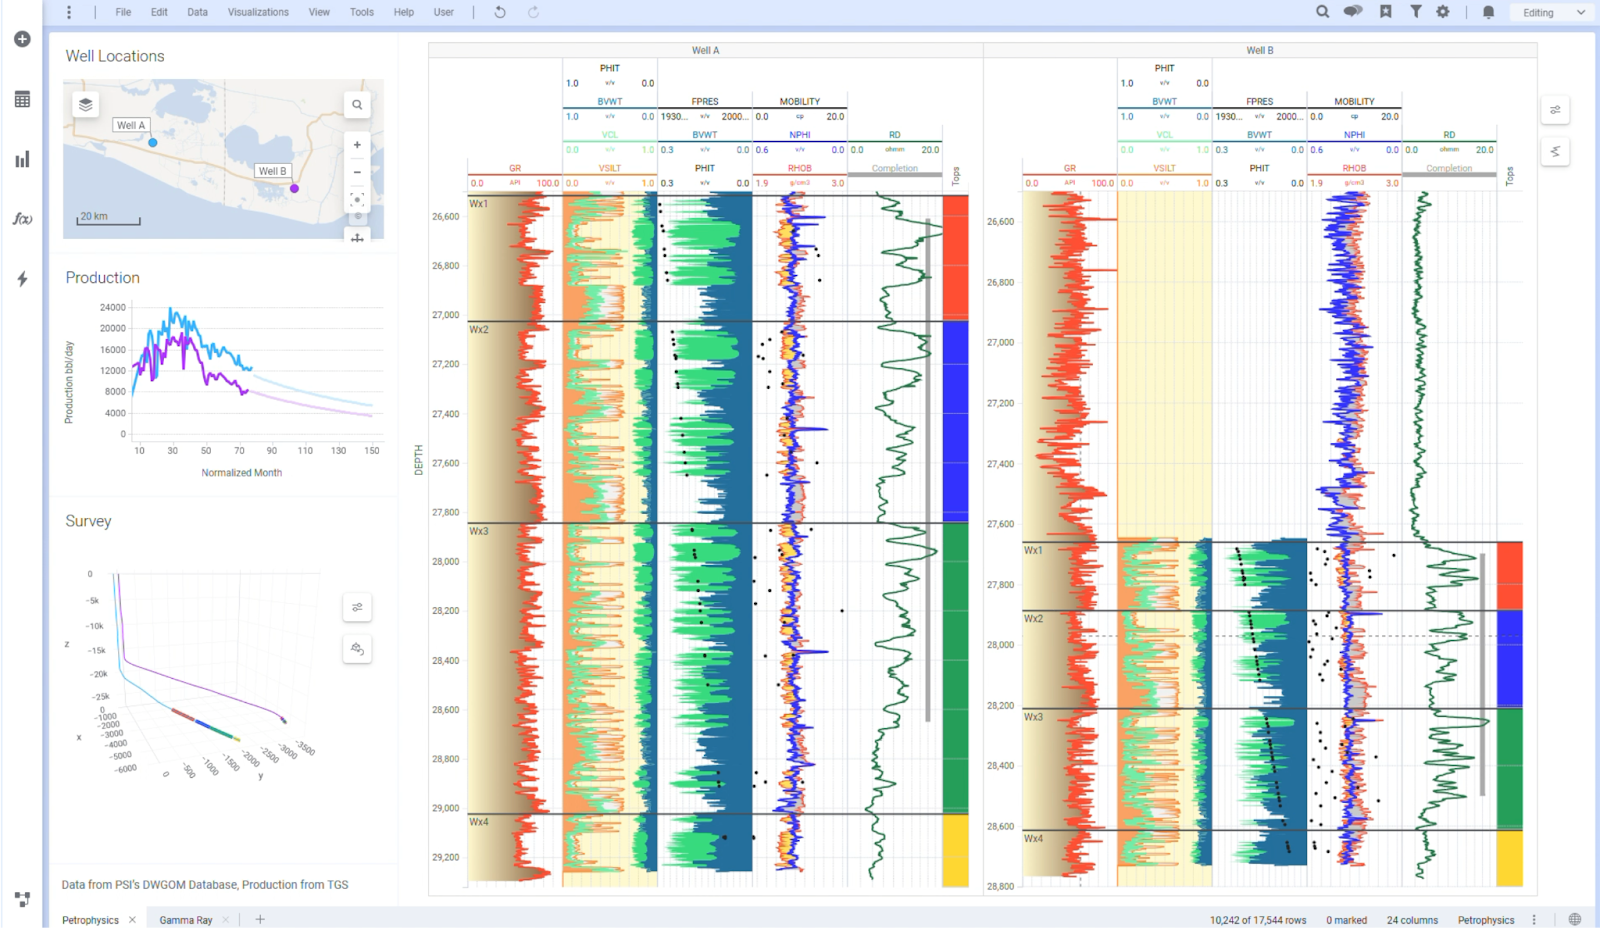
Figure 1: Well log analysis with Spotfire. Well log data for two wells (A and B) are shown in Trellis panels on the right. Well location, production profiles, and deviation surveys are shown down the left-hand side. The well log tracks are L-R: (1) gamma ray, (2) lithogies, (3) total porosity and bulk volume water, (4) neutron (NPHI) and RHOB (density), (5) resistivity. The categorical data for each well is shown on the right of each panel—the grey vertical lines are the completions intervals, and the colored segments are Wilcox 1-4 segments. Data provided by Petrophysical Solutions Inc., from their DWGOM database.
Brad Hopper and Atheer Al Attar provided updates on What’s New in Spotfire. Brad gave a great demonstration of the Spotfire 3D line and surface analysis with data from the Williston Basin in North Dakota. This included analysis of productive wells in the Williston basin over the past 20 years, including 3D surfaces with well paths and formation tops, and well sticks and gunbarrel diagrams from interactive markings. This type of analysis is useful for drilling engineers to understand the sub-surface and choose new well paths to avoid frac hits and optimize production.
Atheer demonstrated the new Spotfire visual data science capabilities in well log analysis, dynamic time warping (DTW), time series, and geospatial analytics. He showed how DTW analysis may be applied to well log data using depth (instead of time) in order to understand how experience with previously drilled wells can apply to new areas that have similar vertical profiles. This enables RoP and time-to-hydrocarbon estimates to be obtained for new drilling ventures, thus optimizing operations and crew time.
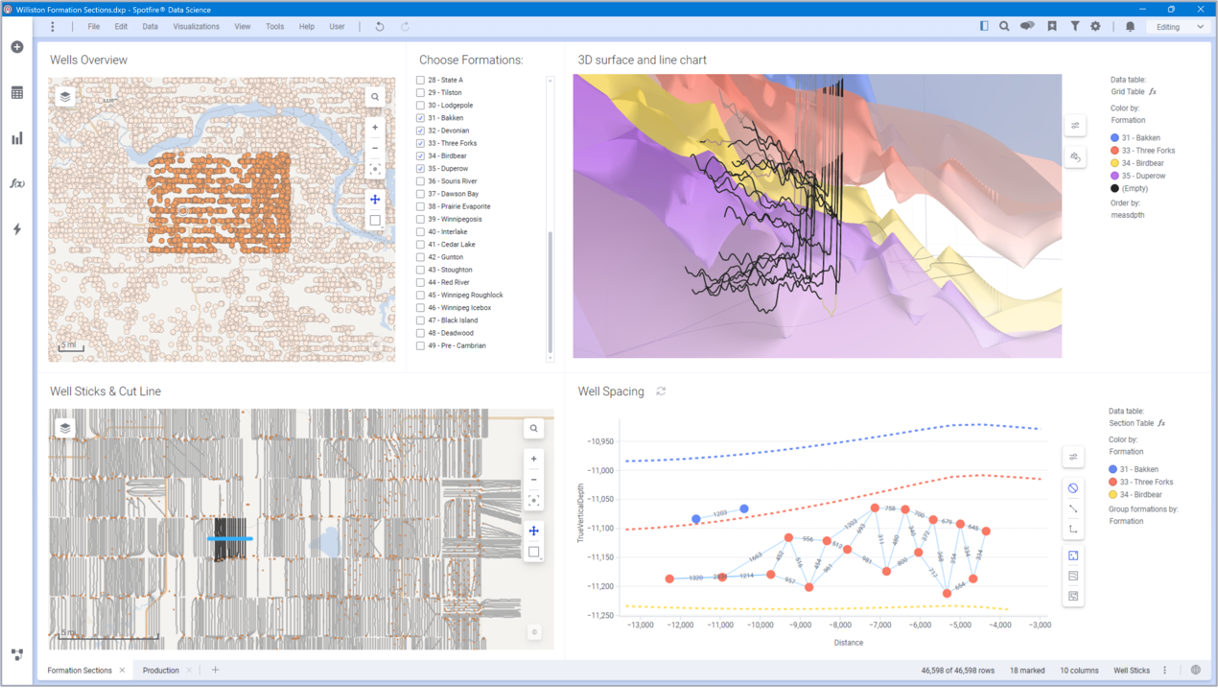
Figure 2: 3D subsurface analysis of productive wells in the Williston basin over the past 20 years, including selection of wells on map (top left), 3D surface with well paths and formation tops (top right), well sticks (lower left), and gunbarrel diagram for selected region (lower right).
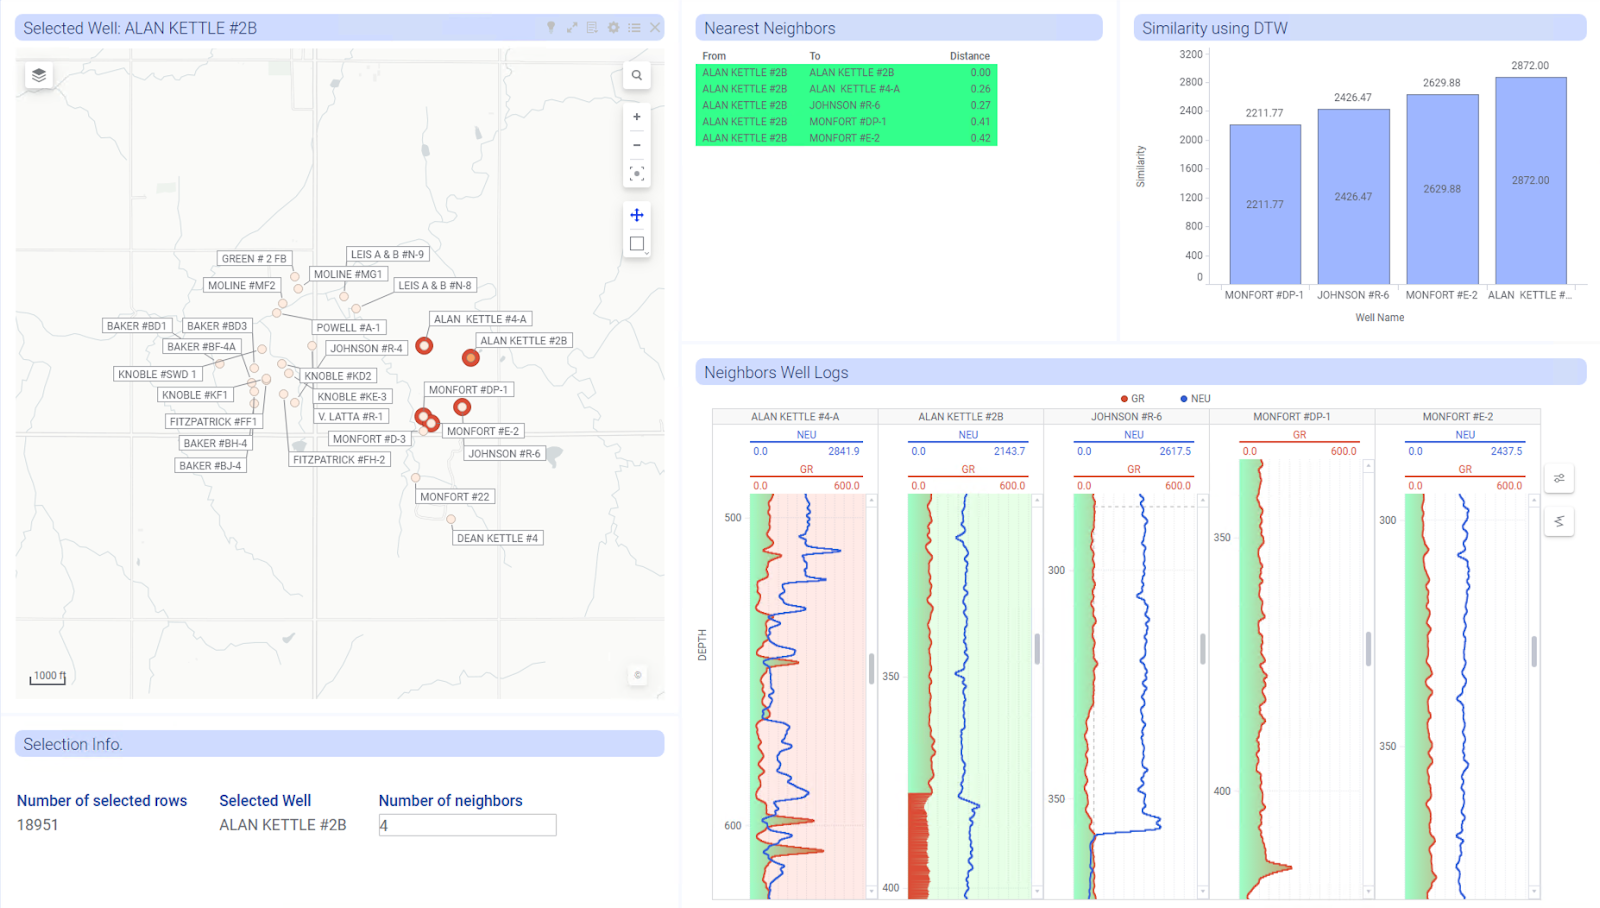
Figure 3: Dynamic time-warping to identify similar wells in a region. Top left shows marking a region of wells, comparing a selected well (Alan Kettle) with 4 neighboring wells in terms of the gamma ray data at each well. Top right shows the similarity of the 4 wells to the selected well (smaller distance on y-axis = more similar). This type of analysis enables learnings from drilling in similar locations to new regions.
The Spotfire ecosystem is thriving
It was fun to network over lunch. This invite-only event included ~180 attendees, a manageable crowd to get around and mingle during the breaks. Pretty much every company from the Houston energy ecosystem was there. It was extra fun introducing engineers, IT, and developers from the same company to one another!
The post-lunch “Dr. Spotfire Collides with Energy Bytes” session featured Spotfire experts and industry leaders Brock Meyer (Wise Rock) and Jon Henderson (Enertel). Brock spoke about the Wise Rock – Spotfire integration, featuring seamless back-and-forth communication via a two-way tethering architecture. Jon featured Spotfire geoanalytics capabilities as part of the Enertel QuantumCast production application. Jose Leviguirre (Dr. Spotfire) and Bobby Neelon (Collide, Drill-Down Analytics) kept the speakers and the audience engaged.
L-R: Jon Henderson (Enertel), Bobby Neelon (Drill Down Analytics), Jose Leviaguirre (Dr. Spotfire), Brock Meyer (Wise Rock)
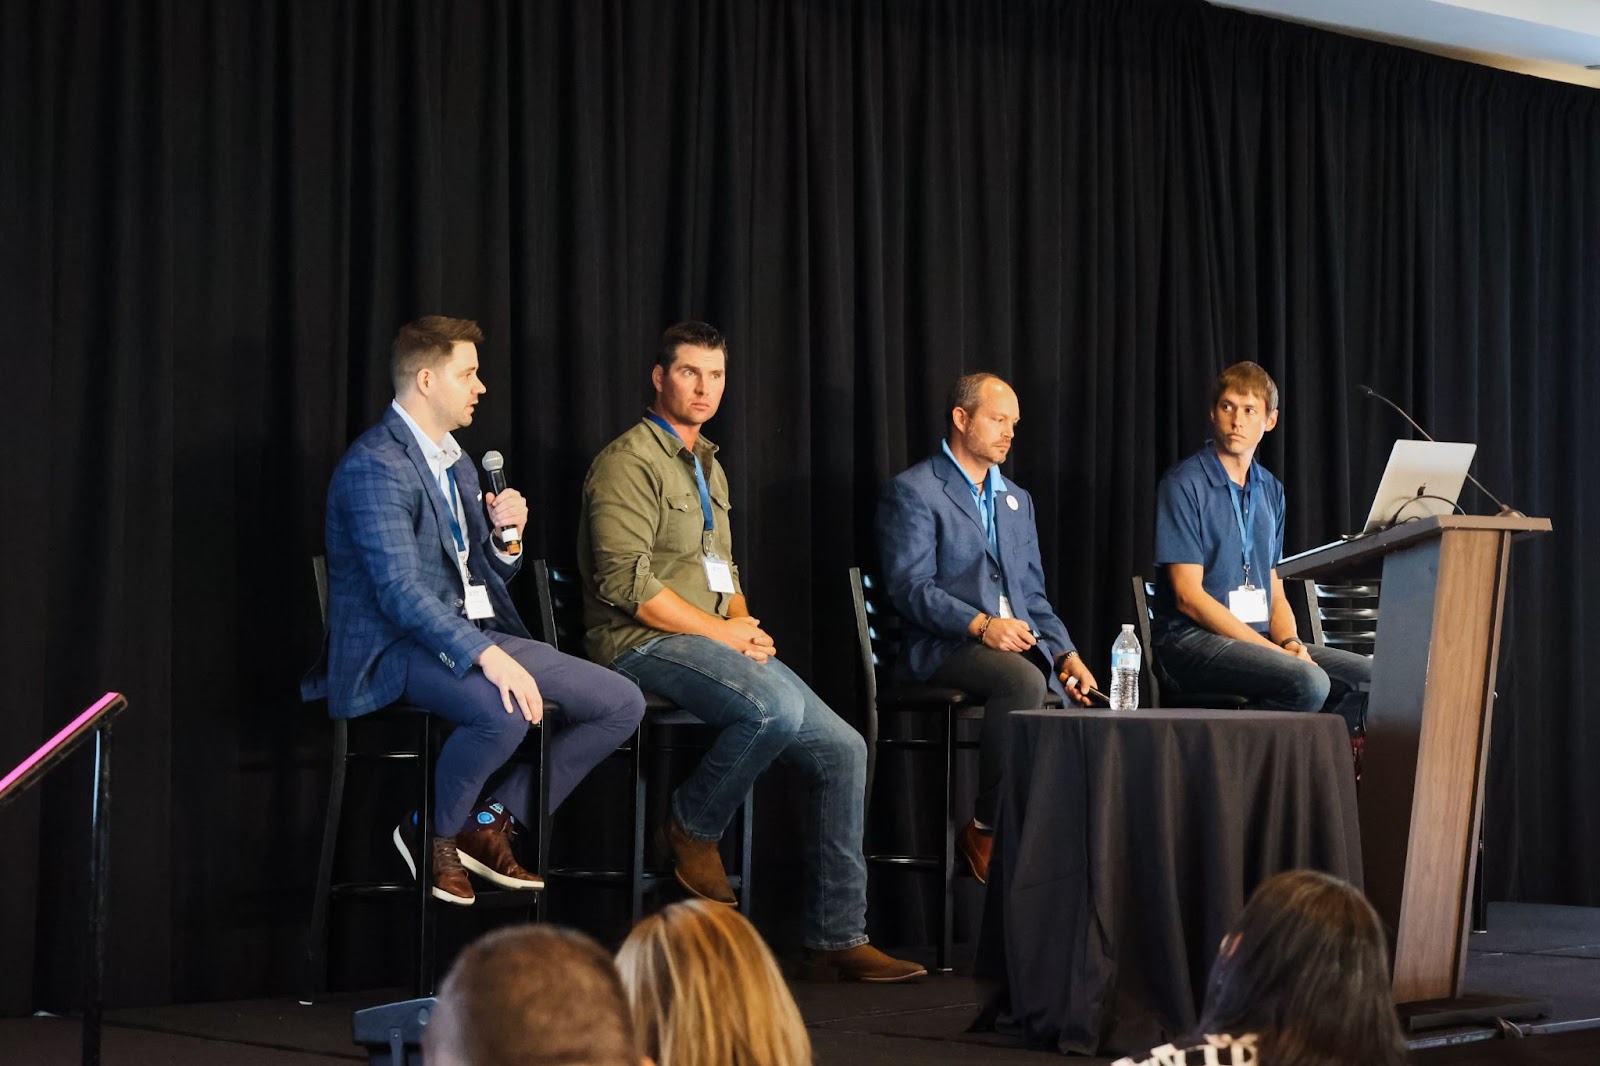
The final panel featured Kyle LaMotta from PetroAI, Amanda Summers from Cadeon, and Toby Burrough from S&P Global.
2025 SEF Community Hackathon
This year’s hackathon focused on geothermal energy, with data from the Utah FORGE project, an international field laboratory managed by the Energy & Geoscience Institute at the University of Utah, and sponsored by the Department of Energy. The challenge was to find the best location to drill the next geothermal well in the UFORGE Project.
Multiple data sets on temperature, pressure, groundwater, seismic data, and logs were included, along with data from specific wells, historical well data, and well logs from multiple locations.
Congrats to the first-place winner, Mario Ortiz-Torres, from Oxy. Mario also gave an awesome presentation on Spotfire for Competitive Surveillance at SEF!! Congrats also to Martin Lozano, Diamondback Energy, who was second, and Jolene Robertson, 4Cast, who was third.
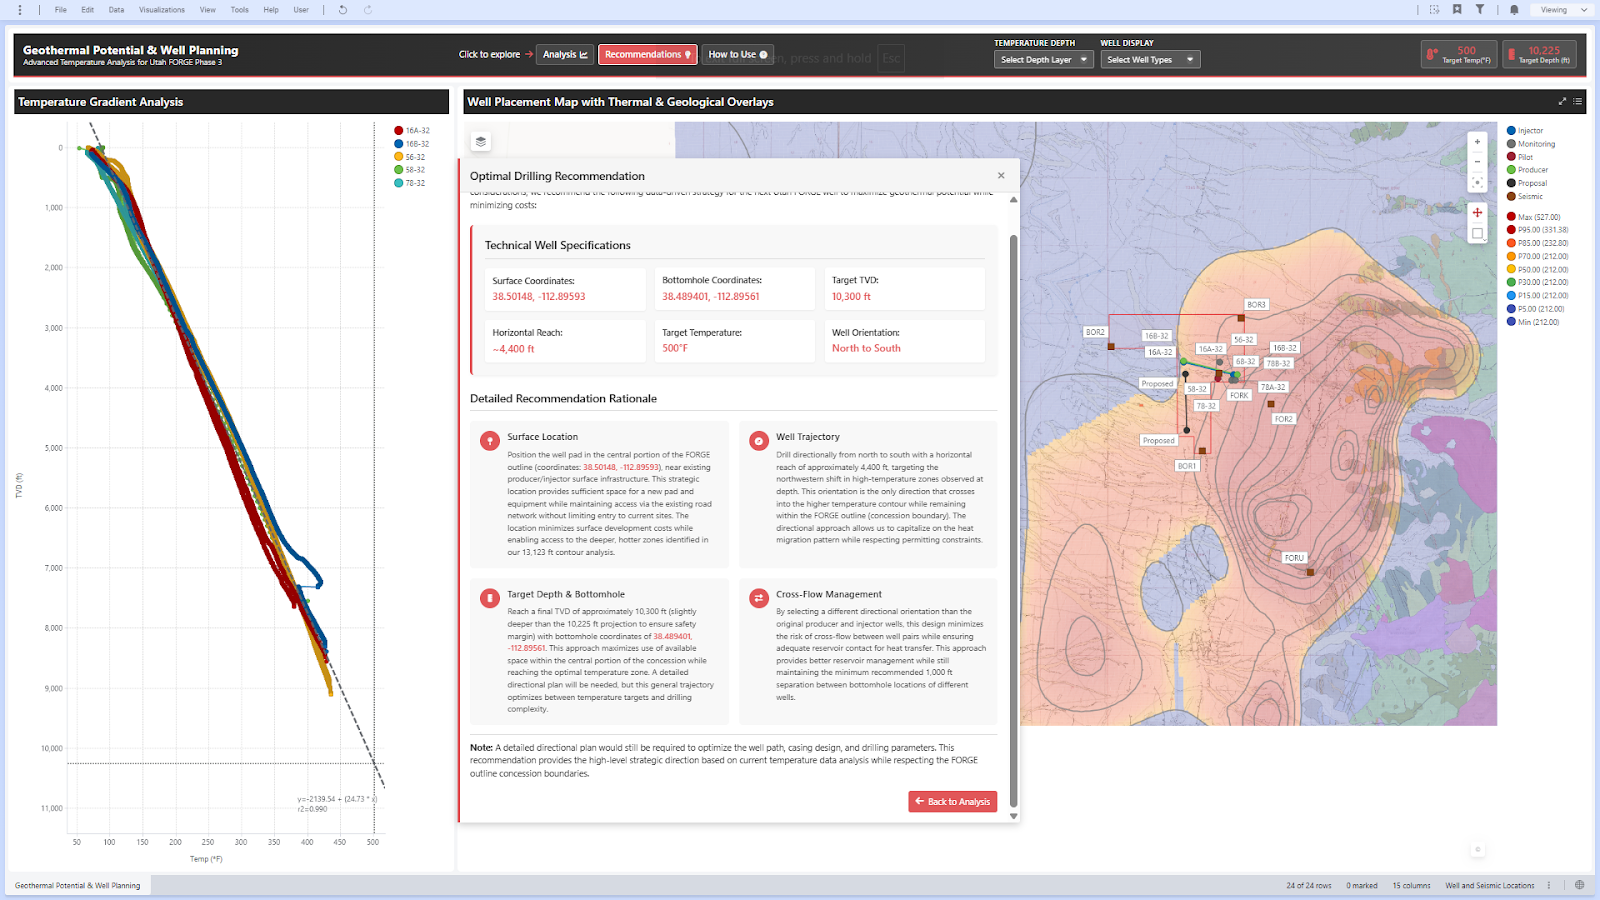
Figure 4: Screenshot of winning hackathon submission from Mario Ortiz-Torres, Oxy. The challenge was to find the best location to drill the next geothermal well, using multiple datasets on temperature, pressure, groundwater, seismic data, and historical well data and well logs from multiple locations.
What’s next for Spotfire?
In keeping with a 20-year tradition, the Energy Forum concluded with a Spotfire Roadmap session led by Daniel Pimentel, Senior Product Manager at Spotfire. Daniel showed some exciting new Spotfire functionality for the future. This included a demo of an ongoing push-compute initiative, including specialized integrations with Snowflake and Databricks. We don’t share our roadmaps publicly, but you can catch a glimpse of the future via your Spotfire Customer Success representative!
We’ll be releasing more case studies, videos, and blogs from the Energy Forum in the coming weeks. So stay tuned for these. And please do yourself a favor—join our Community and Dr. Spotfire program for regular updates!
References
- Spotfire Community – Energy Sector
- Well Log Analysis with Spotfire Data Science
- Dynamic Time Warping
- Real-time Time Series Applications
- Visual Data Science and AI tools for Subsurface Data
- Supercharge your Energy Analytics with Spotfire Data Science
- Spotfire Hackathon 2025
Acknowledgements
Shout out to the amazing Spotfire Customer Success, Data Science, and Architect teams…and to Spotfire Product Management, Verticals, and Engineering…and to the Spotfire Marketing team for a fabulous Spotfire Energy Forum event.