
In industries where diverse categories of data intersect, and performance metrics need to be assessed holistically, making sense of complex relationships can be overwhelming. Identifying strengths, weaknesses, and patterns across multiple variables often requires a visualization that brings everything into focus at once. Enter the Spotfire® Spider Chart Mod, designed to simplify multi-dimensional data analysis. With its intuitive design, this Mod empowers users to compare data across numerous categories in a single, unified chart—making comprehensive data exploration and actionable insights easier than ever.
What is the Spider Chart Mod?
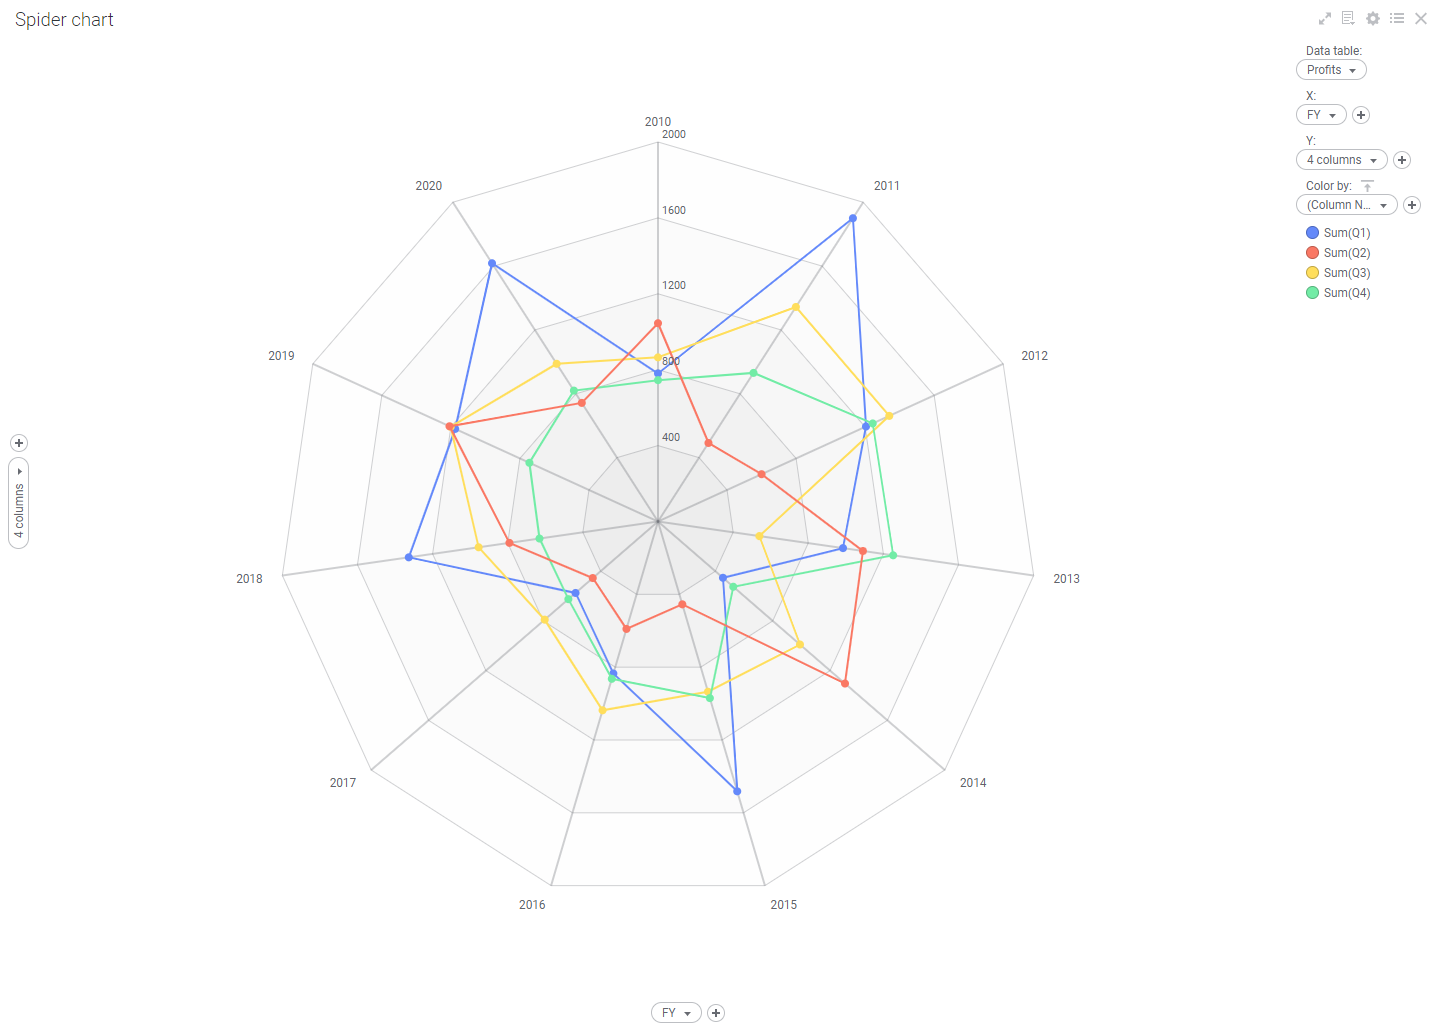
The Spider Chart Mod allows users to compare data across multiple categories on a single, intuitive chart. Often referred to as a radar chart, this visualization provides a way to analyze performance, identify outliers, and compare values holistically.
With the Spider Chart Mod, you can:
- Visualize multi-dimensional data: See how metrics perform relative to each other across categories.
- Spot strengths and weaknesses: Quickly identify areas that are performing well or need improvement.
- Simplify complex comparisons: Analyze data across multiple variables on a single, unified display.
Use cases across industries
- Manufacturing: Compare production metrics like yield, efficiency, and defect rates.
- Oil & gas: Analyze drilling efficiency, equipment uptime, and safety performance across wells or fields.
- Healthcare: Assess patient care metrics across various departments or treatments.
An oil & gas operations team, for example, could use the Spider Chart Mod to compare drilling performance across multiple sites. The clear visualization helps identify high-performing wells and uncover inefficiencies needing attention.
How to get started
Dive into the power of the Spider Chart Mod and transform how you analyze multi-dimensional data. Get the Mod now on the Spotfire Community Exchange.
Stay tuned for our next installment of the Mod of the Month blog; until then, happy exploring, and be sure to check out our latest Mods in our Mods library.