
In today’s fast-paced data-driven world, understanding the performance of your key metrics is crucial. In this month’s edition of our Mods of the Month blog series, we’re taking a look at one of our newest mods, the KPI Mod for Spotfire®. An indispensable tool that enables users to create tailored, visually compelling KPI dashboards that drive impactful decision-making, the KPI mod is already gaining traction across the Spotfire Community. Whether you’re tracking sales performance, operational efficiency, or customer satisfaction, this Mod transforms raw numbers into meaningful, actionable insights.
Key features of the Mod
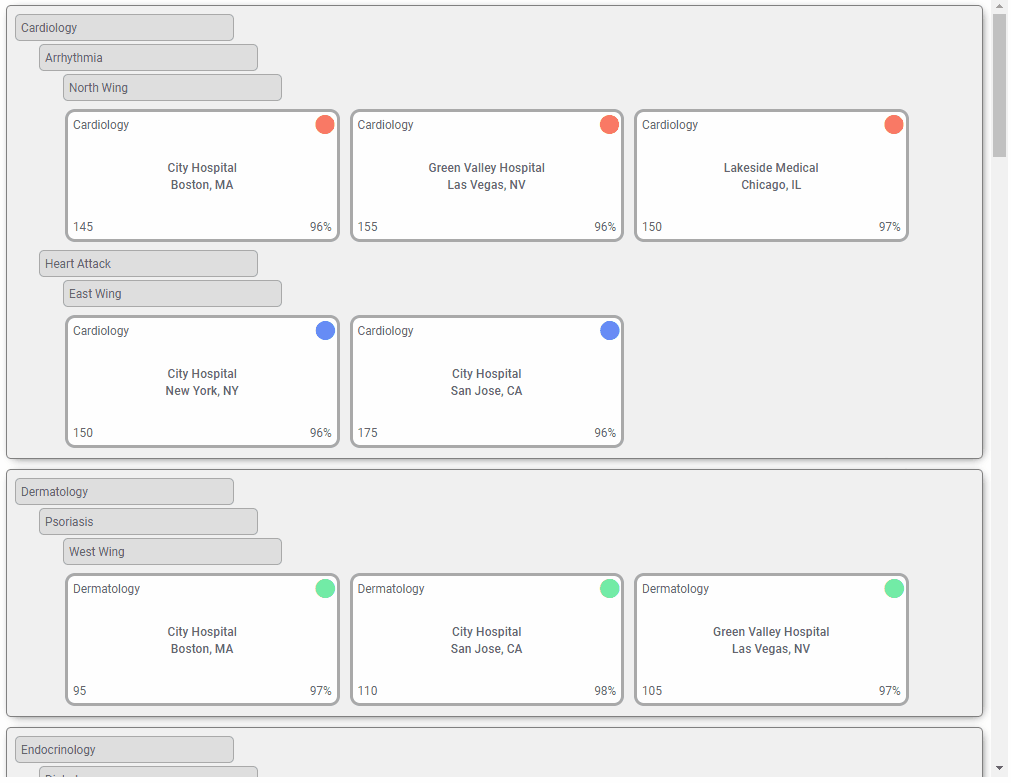
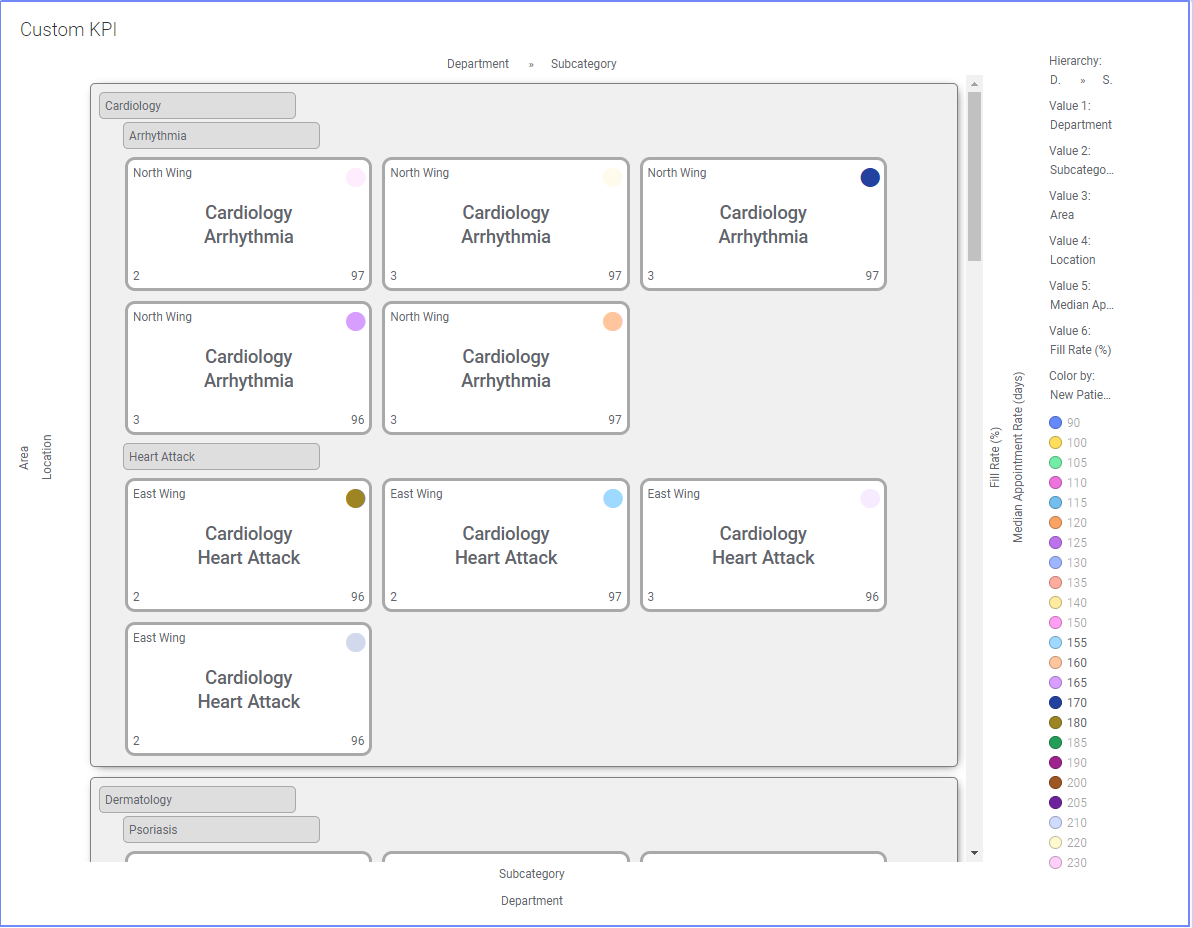
The KPI Mod is a customizable visualization tool for Spotfire that allows users to present Key Performance Indicators (KPIs) with precision and style. By blending numbers with intuitive visual cues, such as icons, colors, and progress bars, the KPI Mod provides you and your stakeholders with a comprehensive view of your data at a glance.
Key features include:
- Customizable layouts: Arrange KPIs in a way that suits your needs, whether it’s a single metric or a grid of multiple indicators.
- Dynamic conditional formatting: Highlight trends or alert thresholds using colors and symbols.
- Interactive data updates: Stay current with real-time data connections and responsive visualizations.
- Rich iconography: Use pre-built or custom icons to enhance context and clarity.
Why choose the KPI Mod?
Standard visualizations are great for exploring data, but when it comes to high-level reporting, simplicity and clarity are, and continue to be, key. The KPI Mod bridges the gap between granular data exploration and executive-level summaries. With its ability to emphasize critical metrics, this mod becomes an essential tool for monitoring performance and achieving strategic goals.
How to get started
Getting started with the KPI Mod is easy. You can download the Mod from the Spotfire Community. Once added to your Spotfire environment, the Mod is fully configurable to align with your unique requirements.
Imagine having your monthly sales figures, operational KPIs, and customer satisfaction scores—all displayed in a sleek, digestible format that speaks directly to your stakeholders. The KPI Mod empowers you to design exactly that.
Real-world use cases
- Sales dashboards: Showcase revenue targets, conversion rates, and top-performing regions.
- Operations monitoring: Track manufacturing efficiency, downtime, and throughput with dynamic alerts.
- Customer insights: Measure satisfaction scores, response times, and loyalty trends in real time.
Unlike traditional dashboards, the KPI Mod focuses on delivering key insights in a compact and visually engaging manner. Its flexibility allows you to blend qualitative insights with quantitative data, creating an experience that resonates with decision-makers.
Ready to revolutionize your reporting?
The KPI Mod is more than just a visualization tool—it’s a game-changer for data storytelling. Transform the way you present metrics and make your dashboards the highlight of every meeting. Download the KPI Mod today, and take your data insights to the next level!
Stay tuned for our next installment of the Mod of the Month blog in the new year; until then, we wish you a fantastic festive season—happy exploring, and be sure to check out our latest Mods in our Mods library.