
In this latest edition of our “From Data to Decisions” blog series, we’re highlighting our newest visualization that helps engineers turn complex directional data into actionable insights: the Polar Plot. Developed with inspiration from our energy sector partners, this new Spotfire® Data Science visualization module is designed to help users make sense of circular, compass-based data, perfect for drilling operations and beyond.
Visualizing wells from a new angle
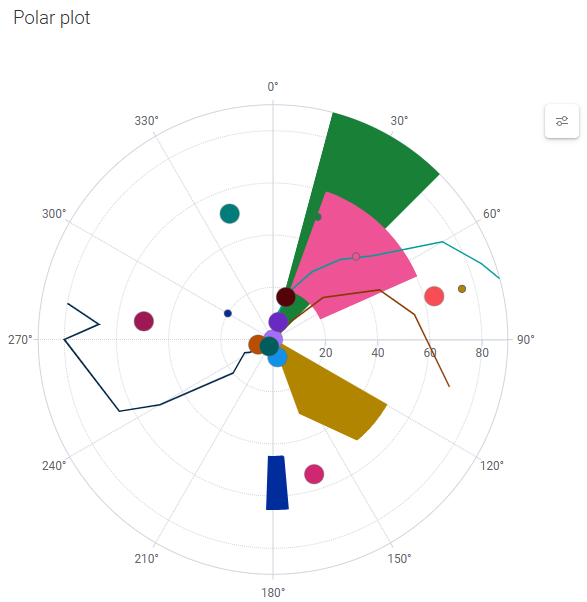
For production and drilling engineers, understanding well deviation is critical. The Polar Plot allows teams to map azimuth versus inclination or azimuth versus measured depth, providing a clear visual of a well’s directional path.
For our readers who are not familiar with azimuth or inclinations:
Azimuth and inclination are two distinct measurements used to define an object’s position. Azimuth refers to the compass direction, measured clockwise from true north in the horizontal plane (ranging from 0-360°). Inclination, on the other hand, describes the angle at which an object is tilted upwards or downwards relative to a reference plane like the horizon or equator (ranging from 0-90°).
Traditionally tracked as lines on cumbersome charts, this data can now be visualized with lines, markers, or filled areas, making it easier to identify deviations, trends, or irregular patterns.

Organizations are able to use this visualization as part of a drilling dashboard solution, enabling field teams to quickly assess well trajectories and take informed operational decisions, reducing risk and improving efficiency.
Beyond drilling: versatility in visualization
While the Polar Plot excels in energy applications, its utility extends to any scenario where direction is important. Other examples include:
- Radio frequency detection – spotting directional signal patterns.
- Particle scatter analysis – mapping angular distributions in lab experiments.
- Industrial sensors – analyzing compass or angular data in process operations.
Unlike the Spider Chart, which compares categories across multiple axes, the Polar Plot focuses on continuous angular data—turning circular complexity into clear, actionable visuals.
Built for engineers and analysts
Interactive and intuitive
The Polar Plot integrates seamlessly with Spotfire’s analytics canvas. Teams can interact with the plot, explore patterns, and drill down into anomalies in real-time, with no scripting required.
Flexible for multiple use cases
Whether it’s a single well, a batch of particle measurements, or directional sensor readings across an industrial site, the Polar Plot scales across scenarios, analysts can configure it once and reuse it wherever directional insight is needed.
Taking the oil & gas and high-tech manufacturing industries as examples, the following use cases are but the tip of the iceberg of what polar plots bring to the table. In the oil & gas industry, polar plots are invaluable for visualizing and analyzing data with directional or cyclical components, which are common in many operational aspects. For example, we have already discussed drilling operations, but polar plots can also be used for Reservoir Characterization. When analyzing naturally fractured reservoirs or induced hydraulic fractures, polar plots can display the orientation and density of fractures. The angle (θ) would represent the strike direction of the fractures, and the radius (r) could represent the frequency or intensity of fractures in that direction. Geoscientists and engineers can utilize these plots to understand the anisotropy of the reservoir, predict fluid flow paths, and optimize well placement and completion designs to maximize production.
In manufacturing, polar plots can help optimize processes, ensure quality control, and understand performance characteristics of products. For Quality Control, for example, specifically for components requiring precise radial symmetry (e.g., gears, shafts, turbine blades), a polar plot can visualize deviations from perfect circularity or concentricity. The radius (r) could represent the deviation from the ideal radius at various angles (θ) around the component’s circumference. This helps identify manufacturing defects, machine calibration issues, or material inconsistencies. It ensures products meet stringent quality standards.
From visualization to decision
By transforming circular data into intuitive visuals, the Polar Plot empowers teams to spot trends, anticipate issues, and make data-driven decisions faster. From detecting subtle directional drifts in wells to revealing concentrated zones in experimental setups, the Polar Plot turns angles into actionable insights.
Ready to explore? Start your free trial now. The Spotfire Data Science trial gives you the freedom to explore your data and gain faster insights for complex problem-solving. Start unlocking full-circle insights in Spotfire Data Science today.