
In my last blog, “The unique value of visual data science platforms,” I explored the importance of bridging the gap between traditional analytics and business intelligence (ABI) platforms and data science and machine learning platforms (DMSL).
As demand for deeper and predictive insights grew, data science professionals executed most of their work in powerful, yet siloed applications built specifically for their needs while leveraging programming languages like Python, R, and SAS to surface enterprise insights. Collaborating with and/or integrating these insights with widely adopted analytics and business intelligence platforms proved to be a challenge and often a serious roadblock for many companies. Line of business teams, business domain experts, and data professionals were left out of the value creation cycle.
Visual data science platforms overcome these challenges via a visual-first approach to advanced analytics, industry-specific and domain-expert features, and seamless interaction with data on a single unified platform.
Let’s explore a couple of use cases that leverage visual data science platforms and how they bridge this gap to deliver value for all three critical personas: data scientists, business leaders, and domain experts.
Energy: Oil and Gas
The oil and gas industry offers a glimpse into strategic use cases that are uncommon and driven by highly skilled domain experts (scientists) with unique data sources. A perfect environment for visual data science platforms.
Think about the cost of oil well placement—leveraging geological, seismic, economic, supervisory control, and data acquisition (SCADA) systems and real-time oil/gas well data. The operational cost of selecting optimal sites easily runs into the tens of millions. Selecting the wrong site can be devastating for an oil and gas company, especially a small one. These decisions are data intensive and require the collaboration of data science, energy domain experts, geologists, and line of business executives at enterprise scale. The visual-first approach of visual data science platforms plays a highly valuable role in these mission-critical projects.
The example below, a 3D combined surface and line chart, becomes the framework for insight, collaboration, and data management—providing the single location for these expert personas to work together and make faster, highly valuable decisions.
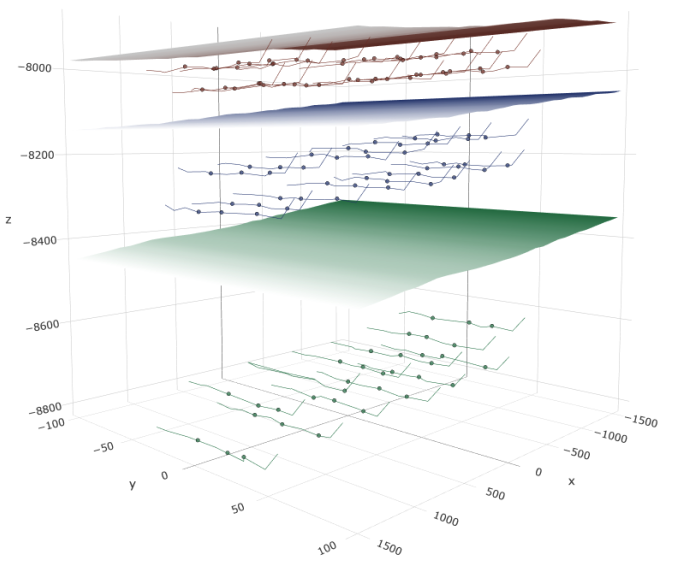
Spotfire® 3D combined surface Mod
Manufacturing
Reducing costs, improving quality, and optimizing operations are top strategic initiatives for companies in the manufacturing sector. Predicting supply chain failures, monitoring machine and tool maintenance requirements, and identifying compliance and regulatory issues at the speed of business are difficult challenges if the teams responsible are working on disparate platforms and data.
Smart factories incorporate all these priorities, and visual data science platforms bring teams and data together to enable them. Manufacturing use cases are highly dependent on timely data from a wide array of machines, processes, and outside third-party data sources to deliver value. Insights not delivered in the small window to act lose value quickly. Historical analysis can be valuable, but real-time and predictive insights drive smart factory value.
An excellent example is continuous process control (CPV), which provides immediate insights into quality variations and often relies on a visual first approach to identify potential material waste and other hidden issues. Consistently tracking quality provides the data necessary to remain compliant with regulatory guidelines. This is non-negotiable in industries like pharmaceuticals, where manufacturers are held to strict US Food and Drug Administration (FDA) guidelines, such as 21 CFR Part 11. Data trustworthiness is a cornerstone of this FDA regulation.
CPV is often part of a digital twin environment that allows domain experts, data scientists, and other stakeholders to clearly see and predict issues in manufacturing processes. These systems work quicker and generally deliver more value when they are collaborative, provide easy integration with data (sensors, streaming data), and leverage the advanced analytics from data science teams. These insights fuel quicker root cause analysis and save factories downtime and money.
Takeaway
Visual data science platforms bring the most critical parts of enterprise insights together on one platform with deep domain expertise, a visual-first approach often built for specific business insights, highly integrated access to data, predictive insights, collaboration, and data science. There is a significant need for these solutions in transportation and logistics, telecommunications, life sciences, financial services, and more.
I’ll be sharing more on visual data science platforms here in upcoming posts, plus an in-depth BARC Spotlight article that will dive deeper into the subject. I look forward to your feedback and questions.
Shawn Rogers, CEO BARC US – Industry Analyst