In today’s data-driven world, businesses are often haunted by the sheer volume, complexity, and unpredictability of their data. It can feel spooky—overwhelming and filled with potential pitfalls, reminiscent of an Alfred Hitchcock movie. How do you make sense of data when it comes in unexpected forms, hides its insights, or keeps you guessing? Spotfire, the visual data science platform, is like a flashlight in a dark room, illuminating the shadows and helping you understand the real story behind your data.
The scary, dare I say spooky side of data—from seemingly disconnected data points to unstructured information and unexpected anomalies, figuring out what’s important can feel like trying to navigate a haunted house. But with Spotfire’s interactive visualizations and advanced analytics, even the most cryptic data becomes understandable, turning confusion into clarity.
Why data can be spooky
The challenges that businesses face with data can resemble the eerie uncertainty of a horror film:
- Unseen patterns: Hidden trends and relationships between data points can lurk in the shadows, making it difficult to extract meaningful insights.
- Data overload: Massive datasets can feel like a creepy forest where it’s easy to get lost. Without a clear path, navigating through piles of information can be overwhelming.
- Unexpected outliers: Data anomalies, much like unexpected bumps in the night, can cause confusion and throw off analyses if not identified and addressed properly.
Without the right tools, these challenges can feel overwhelming. But that’s where Spotfire steps in—taking the fright out of your data and revealing its valuable insights.
Spotfire to the rescue: Unmasking insights with visual data science
Take a dynamic and visual-first approach to tackling your most complicated data challenges, combining interactive visualizations with advanced analytics. Here’s how Spotfire helps you get to the bottom of your spooky data:
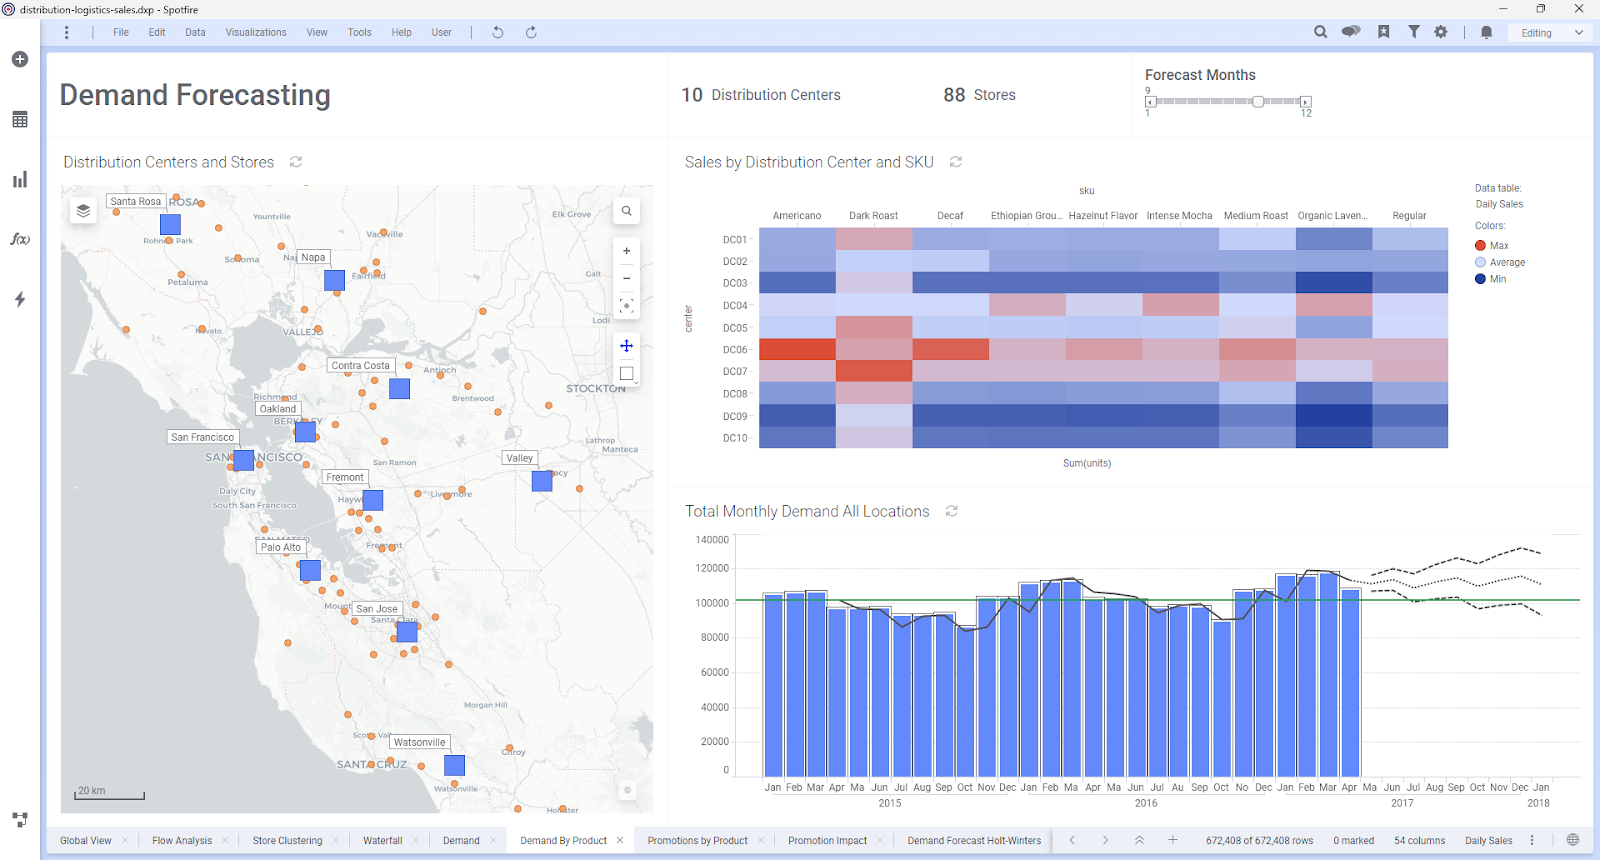
1. Interactive visualizations: Shining a light on hidden patterns
Visualizations in Spotfire are more than just charts and graphs, they are assets, interactive ones that allow you to explore your data dynamically to:
- Uncover relationships: As you zoom in, filter, or highlight specific areas of your data, hidden patterns emerge. For example, you can easily detect correlations between product sales and regional trends, or identify customer segments you didn’t know existed.
- Spot anomalies: Detect outliers and unusual data points that don’t fit the mold. Whether you’re dealing with sales spikes, unexpected expenses, or fluctuations in customer behavior, Spotfire lets you dig deeper into these anomalies and understand what’s driving them.
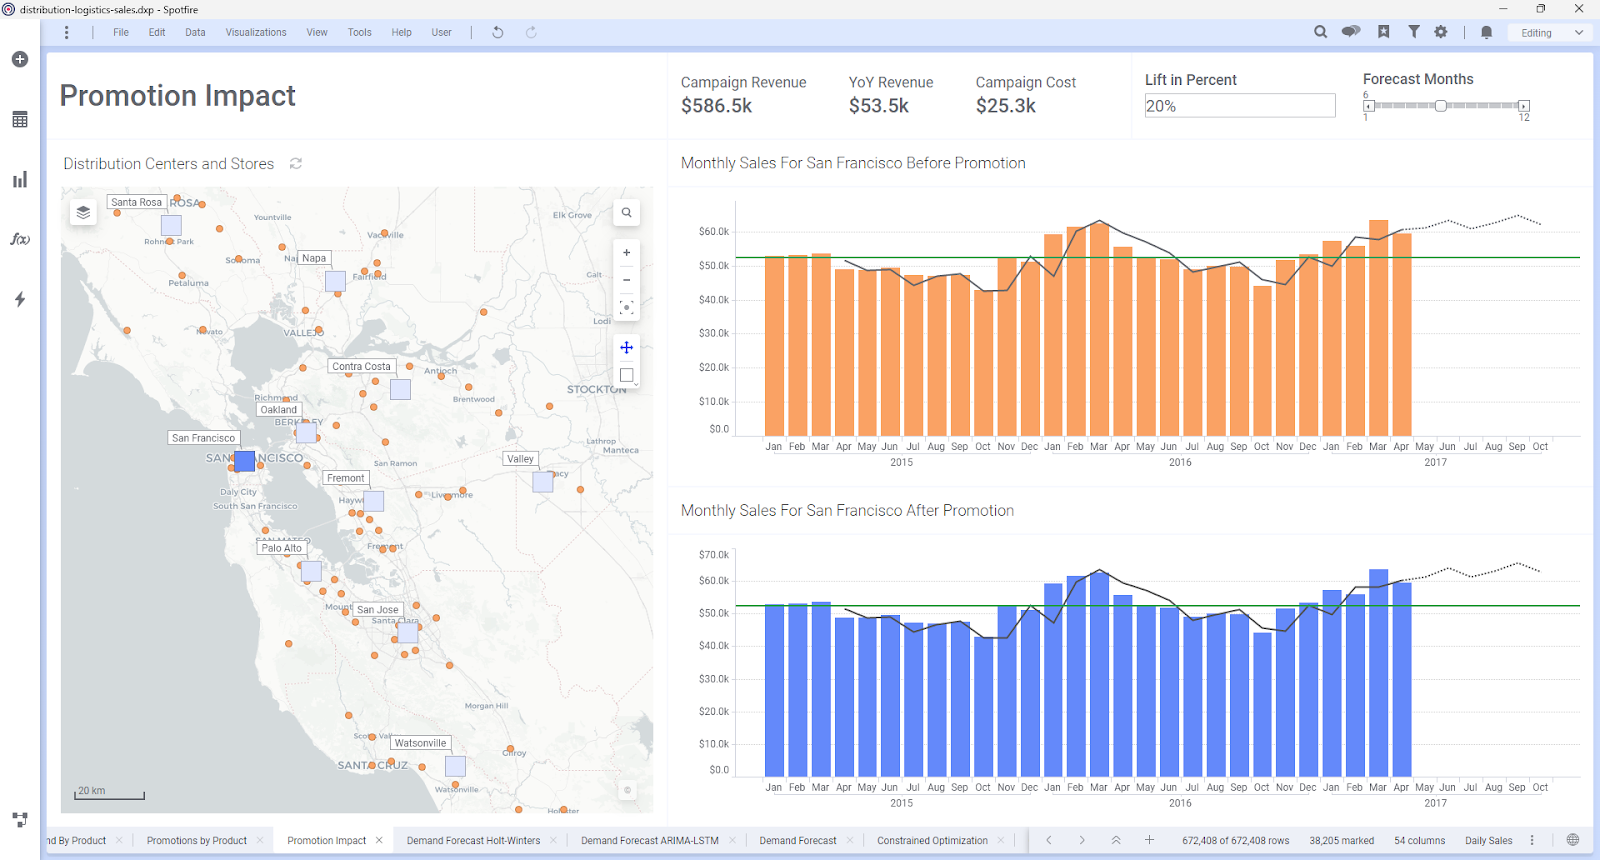
2. Advanced analytics: Predict what’s lurking around the corner
While traditional tools can leave you stuck in reactive mode, advanced analytics capabilities native to Spotfire allow you to be proactive by predicting trends and future outcomes. Predictive modeling comes into play to enable you to predict future trends. Whether it’s forecasting sales, predicting customer churn, or optimizing resource allocation, Spotfire allows you to anticipate what’s next, so you’re prepared for whatever comes your way.
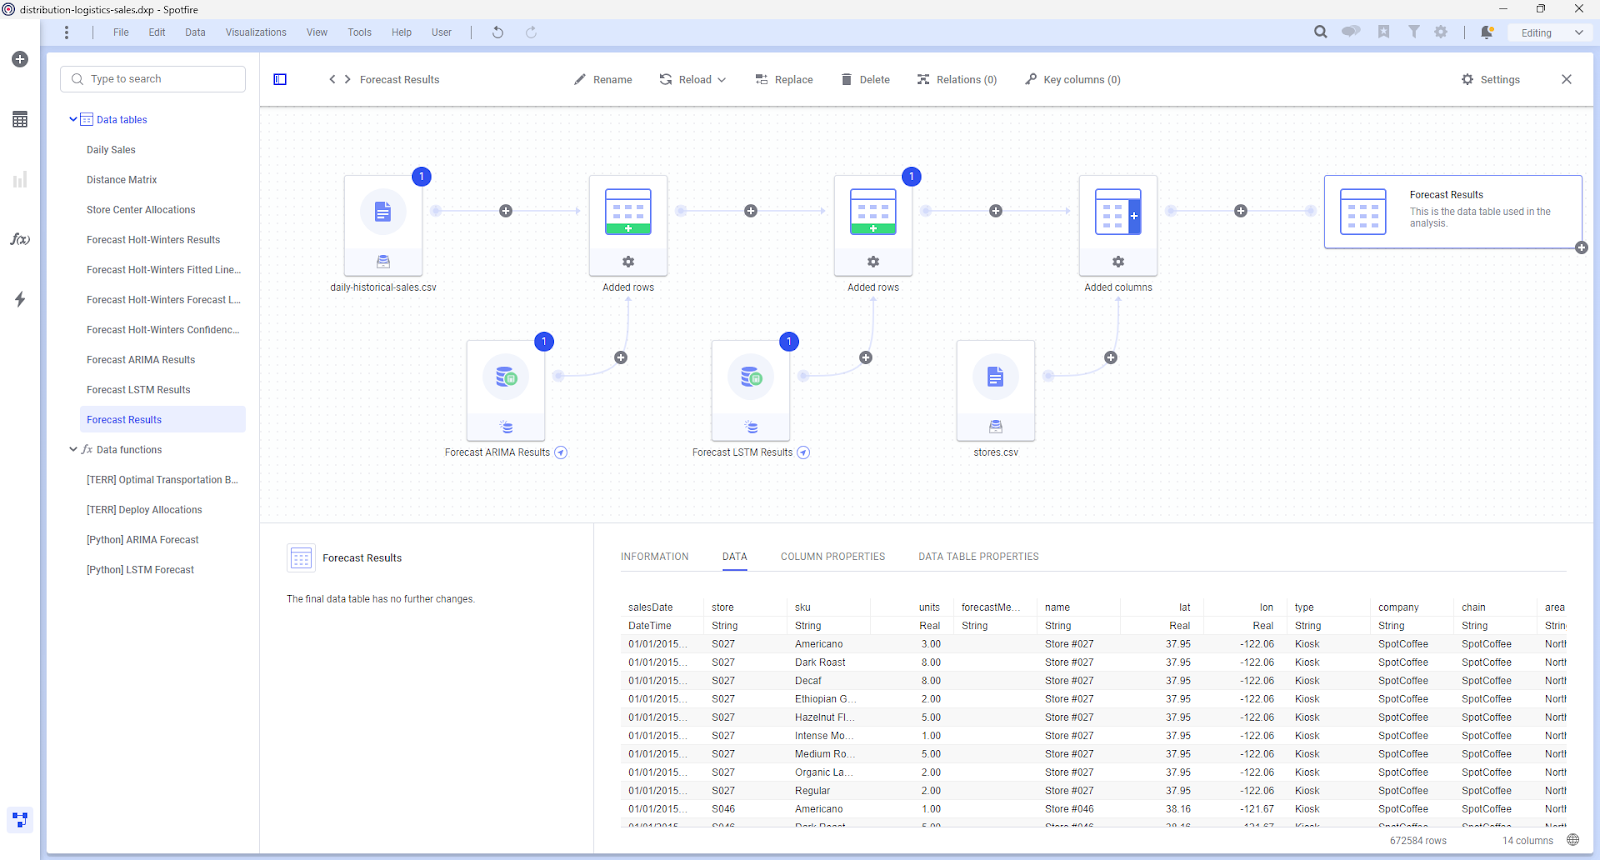
3. Data wrangling: Cleaning up the messy data monsters
Messy, unstructured data can often feel like a pile of tangled spiderwebs. But Spotfire’s powerful data wrangling tools help you clean, shape, and prepare your data for analysis:
- Data transformation: Whether you’re dealing with inconsistent formats, missing values, or improperly structured data, Spotfire offers an intuitive interface to transform and prepare your datasets.
- Combining multiple sources: Spotfire makes it easy to combine data from multiple sources, allowing you to unify your internal systems, databases, and third-party information into a single, cohesive view.
No need to fear data anymore
Take the fright out of data chaos with Spotfire. Spotfire turns spooky data into a treasure trove of insights, helping businesses in industries from finance and retail to healthcare and manufacturing unlock hidden value. Whether it’s through dynamic visualizations, predictive analytics, or advanced data wrangling, Spotfire ensures that you’re always one step ahead, ready to face any challenge your data might throw your way.
Don’t let spooky data keep you up at night. No matter the use case, even if it’s analyzing haunted house data sets, Spotfire is here to help you make sense of the most complex datasets, giving you the confidence and clarity to act. Because, in the end, the only thing scarier than messy data is missing out on the insights that could be the key to unlocking mysteries and reaping the benefits.
Ready to unmask your data’s hidden potential?
Try Spotfire today, take the fear out of your data journey, and tap into the power of visual data science.