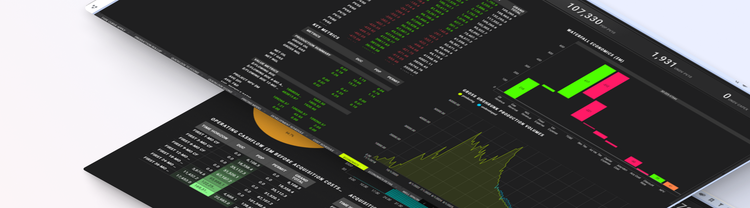
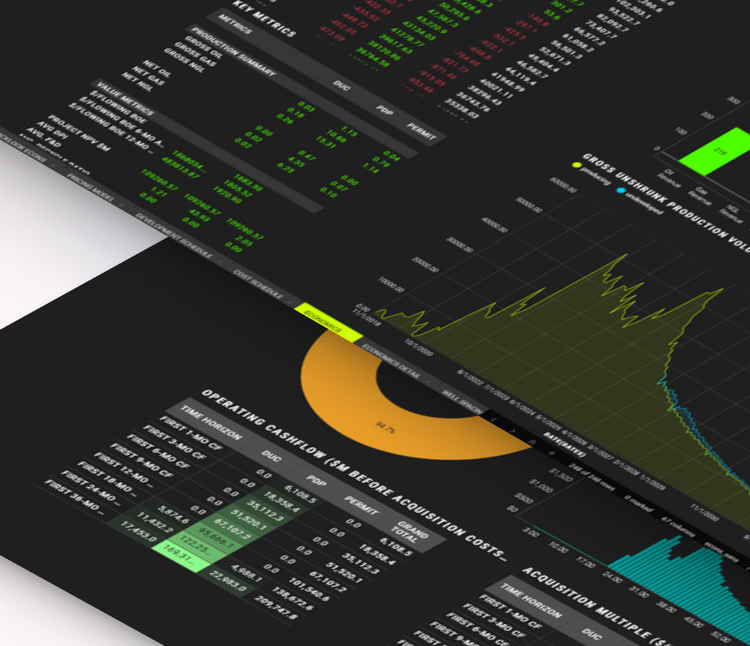
From Fragmented Data to Confident Asset Decisions: Introducing Spotfire® Accelerators for Upstream Energy
Every upstream investment decision rests on a few numbers: what the producing wells will deliver, how many locations remain undrilled, and what share of it all you actually own. Too often those numbers are assembled by hand from separate systems and presented as a single figure, with the derivation hidden. When someone challenges an assumption, nobody can quickly show what changes.
With the Enertel acquisition complete, Spotfire® is bringing the capabilities Enertel developed into Spotfire® Industry Pro as Spotfire Accelerators, so teams can start from a working solution instead of a blank page. Here is a closer look at the first three.
What is an Accelerator?
Most industrial analytics work starts the same way. A team has a high-value problem, data spread across several systems, and no working place to begin. Spotfire Accelerators are that starting point: fast-start applications that combine Spotfire data connectors, visualizations, data pipelines, data science functions, and actions into a working solution for a specific industrial analytics problem. Along the way, they show best practices and useful techniques for getting more from the platform.
They are built for the engineers, scientists, and IT professionals who need actionable insight quickly, and they are built and tested for real workloads, so teams can trust what they start from. Scope ranges from broad use cases to specific, high-value workflows, and Accelerators are available across priority industries including energy, high-tech manufacturing, life sciences, and transportation and logistics.
Spotfire Accelerators are building blocks. Teams adapt and extend them to fit their own data and ways of working, using them as the foundation for their own solutions. They start the work without limiting where it goes — less time spent building, more spent on the decisions that matter.
The new Spotfire Industry Pro Accelerators that we are discussing in this blog, build on the capabilities Enertel developed as QuantumCast™ and are available to Spotfire Industry Pro customers through the Community Exchange and the in-product browser, effective immediately.
Upstream Asset Valuation Accelerator: a defensible number inside the bid window
A bid window lasts a few weeks. In that time, a team must forecast every producing well, work out how much acreage remains undrilled, and turn both into a number an investment committee will sign. The calculations themselves are well understood. The hard part is that a defensible answer needs well inventory, production history, ownership, and price and cost assumptions reconciled on the same well set, usually from different systems.
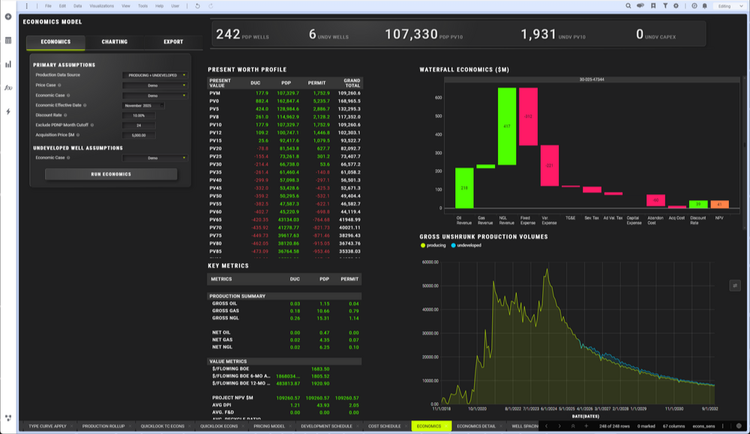
This Accelerator does that assembly once, then keeps the full workflow in one place:
- Forecast every producing well in one run. Select wells on the map, set the fit parameters, and run the batch as a data operation. Forecast years, minimum fit months, abandonment rate, peak detection, and fit quality are configurable, and phase behavior is classified from gas-oil ratio, so gas-primary wells aren’t forecast like oil wells. When a fit is wrong, such as a well that was shut in and restarted, click a point on the production chart to refit from there.
- Build type curves where history falls short. Recently completed wells, or wells that have been down for most of their life, can’t be forecast from their own production. Type curves from comparable wells fill the gap. They are normalized to lateral length and can be aggregated by interval, operator, a custom column, or a combination of two.
- Assess how densely the field has been developed. Lateral lines are generated from well header data, and you can build a gun barrel plot for any selected subset of wells. A spacing table by operator and interval is written back into the well header data, where the rest of the analysis can use it.
- Find where the rock is better. Any numeric column in the well header data can become a mapped surface, with probability and quantile plots alongside so the distribution behind the map is visible.
- Put a date on the undeveloped locations. Schedules are built from drilling and completion pacing, risk is applied to both well and acreage, and locations are assigned reserve categories from proved developed producing through possible.
- Price it. Price and cost assumptions are held as named cases, with NYMEX, flat, or hybrid pricing and proprietary decks supported. Quicklooks plot average present value and internal rate of return against oil and gas price. Change the deck and re-run in minutes, because nothing has to be rebuilt.
The outcome: a valuation with the evidence still attached, produced inside the window rather than after it.
Well Inventory Accelerator: remaining locations you can show how you counted
Producing wells have histories and decline forecasts. Wells that don’t exist yet are different: how many there are, where they would go, and whether anyone would drill them. That count is often calculated less than asserted. Someone picks a spacing, divides the acreage, and rounds, and it can account for a large share of what a buyer is asked to pay. The inputs sit in three places: well data in a provider query, spacing units in land and GIS systems, and a spacing assumption that is judgment, varies by interval and reservoir, and is rarely written down.
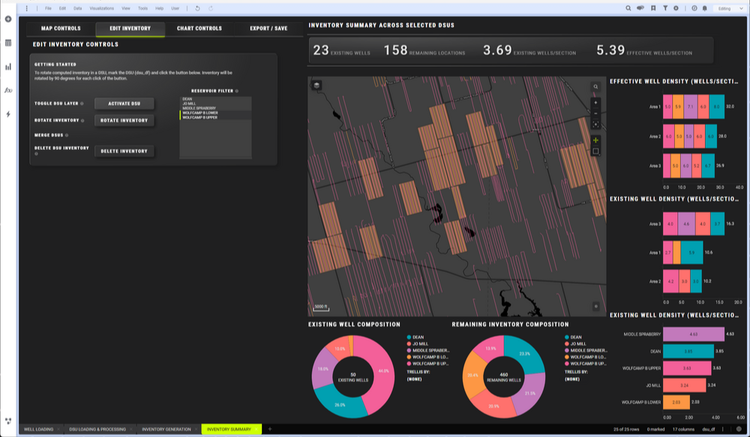
This Accelerator makes the count the output of a process:
- Start from the spacing units you already maintain. Load drilling spacing unit shapefiles from the land team, and where a unit needs adjusting, generate a grid around it with resolution and buffer set by sliders and redraw its boundary. Units can be adjusted, discarded, and redone, because recorded boundaries rarely match how acreage would be developed today.
- Correct intervals first. Interval aliasing fixes reported intervals before anything is generated. It also corrects landing zones for permits and drilled-but-uncompleted wells, where the reported interval is often wrong or missing.
- Turn spacing assumptions into location counts. Density is entered per combination of unit category and reservoir interval, not applied globally, so a tighter assumption in one interval and a looser one in another is a configuration, not a separate analysis. The sensitivity that usually gets waved at in a meeting can simply be run.
- Check it, adjust it, hand it on. Summary statistics compare existing wells with remaining inventory, a quick test of whether the result is credible. A single unit’s generated locations can be rotated, even when the default pattern ignores how the operator actually drills.
The outcome: an estimate that is still an estimate, but one you can show your working for and revise in minutes when someone disagrees.
Minerals and Royalties Accelerator: know what you own, check what you’re paid, watch what surrounds you
A mineral owner faces a different kind of uncertainty than an operator. Three questions rarely get answered: what do I actually own, am I being paid correctly, and what is happening around my land? The evidence for all three arrives in the data owners already receive, but it is never brought together.
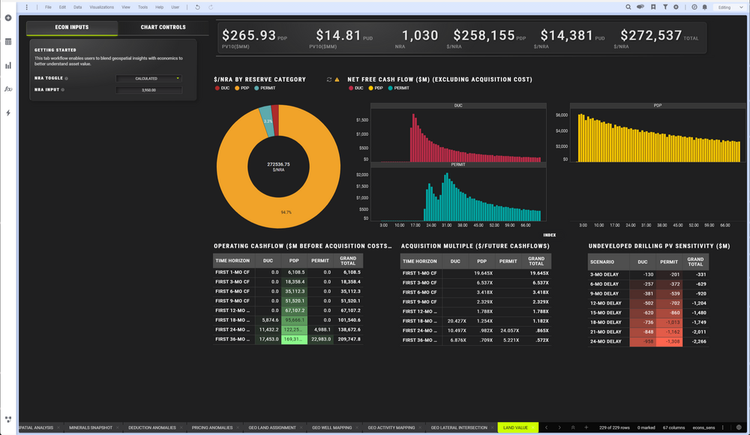
- What you own, well by well. Tract and unit shapefiles rarely agree, so the Accelerator calculates acreage overlap and produces a layer with net royalty acres and net revenue interest. If your land team has pre-calculated figures, they appear alongside the calculation, so you can understand differences before anything downstream relies on them. Implied ownership is then calculated from the exact footage of each wellbore inside each tract, rather than assigning a well by its surface-hole or bottom-hole location.
- Whether the check is right. Deductions such as gathering, compression, processing, and marketing are broken out by description and amount over a configurable trailing window, with click-through summaries that answer when an anomaly started. Realized pricing is calculated per check stub, and every payor is plotted against a benchmark price, making above-market and below-market deductions visible at once.
- What’s happening around your acreage. Fracs, laterals, permits, rigs, and well locations are mapped against a tract or unit, with a distance buffer you size so activity on your boundary stands out from noise across the basin. Lateral and activity sources are swappable, so the same map works with public and proprietary well sets.
- Value per acre. Economics are re-presented in dollars per net royalty acre, split by reserve category so producing and speculative income are never confused, with a delay sensitivity showing how value moves if the operator’s undeveloped wells slip.
The outcome: judgment stays with the expert, and the reconciliation no longer falls to them.
Better together
The new Spotfire upstream Accelerators share a foundation. Well Inventory exports the same geometry that feeds the minerals intersection workflow, so valuation and ownership position work from the same set of locations. The ownership table from Minerals and Royalties feeds back into the valuation workflow as its ownership input, closing the loop between land position and economics.
None of this replaces the tools upstream teams already use. It connects their insights in one visual environment, so teams can explore subsurface, production, ownership, and economic signals together.
Get started
Explore how Spotfire supports upstream asset valuation, or read the Community articles on Upstream Asset Valuation, Well Inventory, and Minerals and Royalties. See the Enertel Acquisition FAQ for integration details. To discuss your use case, contact us.