Seeing beneath the surface: Revolutionizing subsurface analysis with Spotfire
For upstream energy, the answers to the most critical decisions often lie hidden beneath the surface of the earth, in layers of rock formations. Understanding the structure, composition, and potential of the subsurface can mean the difference between a productive well and a costly misstep. Spotfire®s interactive visual data science experience enables engineers and geoscientists to analyze subsurface data, along with other exploration and production data, for rapid insights into the effects of subsurface geology, and drilling / completions strategies on production. With all the data bush-linked at one's fingertips, geoscientists can analyze subsurface data with more speed, precision, and clarity than ever before.
The seismic data challenge
Seismic data holds the keys to identifying potential hydrocarbon reservoirs, but it's also notoriously complex. Millions of signal traces generated by seismic waves are condensed and interpreted, often on tight timelines. Traditional workflows, involving manual interpretation and static maps, are slow and prone to oversight.
Spotfire changes the game. By combining advanced analytics with interactive visualizations, the platform enables users to reduce data dimensionality and uncover meaningful patterns. Using unsupervised learning techniques such as principal component analysis (PCA) and self-organizing maps (SOM), Spotfire enables engineers to isolate relevant structures and signals from seismic noise, transforming the massive seismic datasets into intuitive and actionable insights.
In particular, the PCA components can highlight geological features such as folds and channels, and by linking the SOM to seismic horizon visualizations, one can explore subsurface features. In this way, the SOM can highlight geological regions of interest; and these regions can be analyzed in context of existing well locations to assess new wells and potential production profiles.
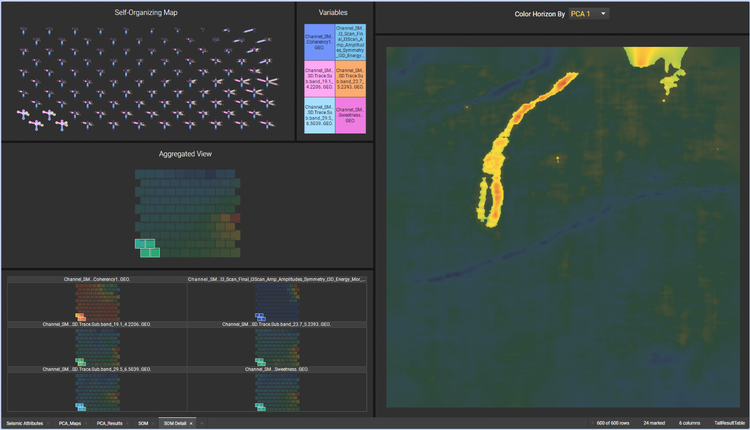
Figure 1. Unsupervised learning analysis of subsurface features, horizons and geologic regions.
Dimensionality reduction and mapping pay zones
Imagine transforming thousands of signal traces into a three-dimensional representation of the subsurface. With Spotfire, engineers can visually explore subsurface formations, highlight regions of interest, and rapidly identify pay zones, areas likely to yield hydrocarbons. In addition to signal traces, engineers can analyze well logs, core data, well tests, and production data — all at their fingertips, in an immersive visual data science experience.
The result? More confident drilling decisions, fewer dry holes, and a dramatic reduction in time spent interpreting hidden data. With Spotfire, data from the subsurface comes to life for engineers and geoscientists.
From map to model: Optimizing well placement
Drilling is expensive, and well spacing matters. Place a new well too close to an existing one, and you risk frac hits, interference between wells that drains efficiency and increases risk. Spotfire provides powerful 3D visualizations and industry-specific tools, such as gun barrel plots, which offer a sideways view of horizontal wells. These visuals help engineers identify optimal placement for new wells while avoiding interference with existing production.
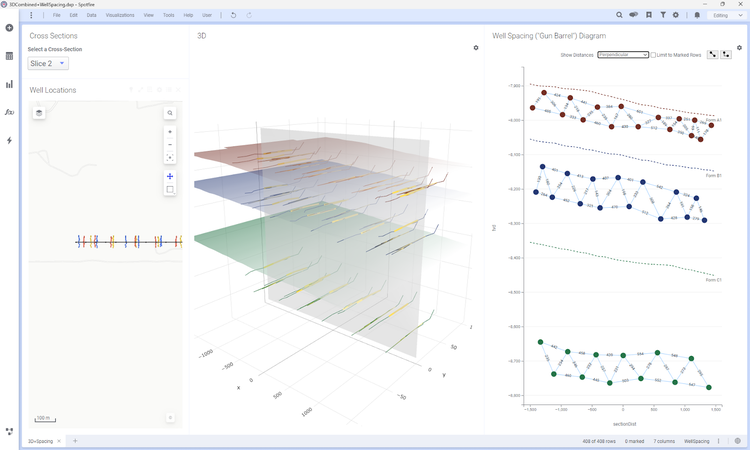
Figure 2. 3D subsurface analysis of geology, well location and spacing.
The key to this multi-dimensional visual analysis is the interactive rotation of the 3D subsurface and a measuring tool that can be used in-situ, allowing engineers to measure spacing in any direction on any rotation. This enables geoscientists and engineers to evaluate geological features, and simulate new drilling scenarios within a single visual canvas. With this kind of insight, planning becomes more strategic, and field development more profitable.
Well-log analysis
The Spotfire Well Log Analysis is detailed in a Spotfire community article.
In the analysis below, the right-hand side shows a trellis display of two wells, A and B, with measured depth on the y-axis; and petrophysical and well log curves laid out in tracks across the top, with one well per trellis panel. The map in top left shows the well locations and below that, the production profiles and deviation surveys for the two wells.
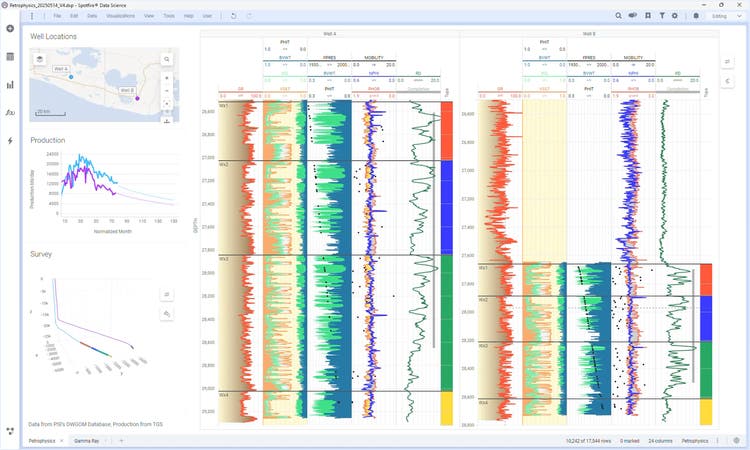
Figure 3. 3D subsurface analysis of geology, well location and spacing.
The Spotfire Well Log Analysis in the community article also includes a rapid fire assessment of more focused datasets e.g. gamma ray and volume shale, across many locations. This simple visual data analysis enables interactive evaluation of many sites and locations across reservoirs and resource plays.
AI as an ally: Code-free insights from Spotfire Copilot
The complex data and sophisticated analytic workflows described above may be accelerated with the Spotfire CopilotTM AI assistant. Engineers can use simple prompts and natural language to generate Spotfire visuals and Python data science functions that import and process geophysical data, estimate shale volumes, and create visual well logs.
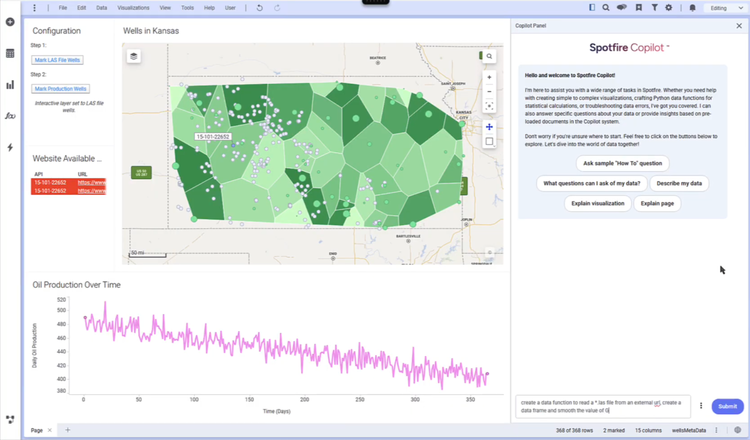
Figure 4. Spotfire Copilot – a conversational interface to Spotfire for generating Spotfire visualizations and data science functions, interrogating data and obtaining tips for visual data science analyses, with energy sector context.
Real-world impact: Subsurface insights in action
Wintershall Noordzee, a leading offshore exploration and production company, faced a familiar challenge: seismic, logging, and well data were fragmented across disparate systems, slowing down subsurface decision-making. To overcome this, the company used Spotfire to develop the Crossfire portal, a centralized, self-service analytics platform that consolidated the company's entire subsurface dataset.
With Crossfire, geoscientists can now explore dozens of variables simultaneously, from seismic interpretations and well logs to borehole geometry and lithology. Instead of waiting hours for queries from multiple systems, users can visually interact with the data in real time, accelerating candidate well evaluation and reducing uncertainty.
The platform allows Wintershall's teams to overlay geological structures, filter by rock unit or depth, and even map seismic anomalies against historical production data. This has transformed how the company assesses formations and prioritizes drilling targets, empowering exploration and subsurface teams to make better, faster decisions with a clearer picture of what lies beneath.
Real value delivered
Spotfire is more than just a visualization tool; it's a subsurface decision engine. By reducing the time needed to analyze seismic data, improving the accuracy of reservoir characterization, and enabling smarter well placements, Spotfire delivers measurable business value:
- Faster time to insight: Interactive analytics dramatically reduce seismic interpretation timelines.
- Lower drilling risk: High-resolution visualizations help avoid frack hits and misplaced wells.
- Higher production: Better data leads to better well placement and more efficient recovery.
- Broader access to analytics: AI-guided tools democratize geoscientific analysis across teams.
Spotfire®s interactive visual data science experience puts all the data at the fingertips of engineers and geoscientists. This enables them to analyze subsurface data along with exploration and production data for crisp scenario modeling and simulation.
Whether you're working in exploration, reservoir engineering, drilling or completions, Spotfire®s interactive brush-linked user experience provides the tools to see beneath the surface and act on what you find. Explore how Spotfire can make your subsurface workflows smarter.
References & Acknowledgements
Well Log Analysis in Spotfire– Michael O'Connell, Glenn Hoskins, Atheer Al Attar
Data credits
Well log data from Petrophysical Solutions' PSI DWGOM database, Production data from TGI, Seismic data from IHS Markit / S&P Global