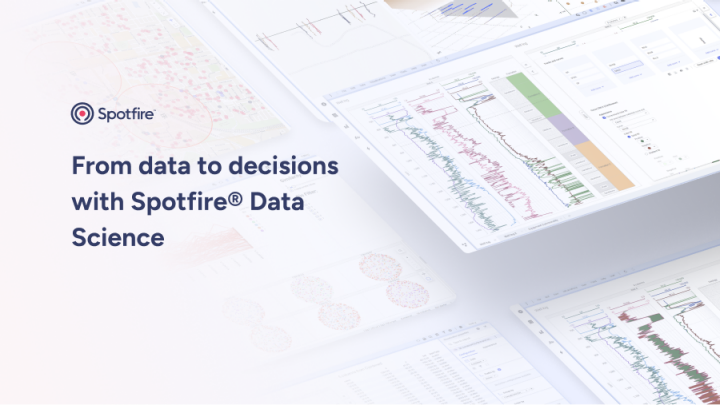
From data to decisions: How Spotfire® Data Science redefines industry-specific analytics
For the past year, our Mod of the Month blog series has been a fantastic way to showcase the versatility of Spotfire® Mods. From enhancing sustainability insights in manufacturing to visualizing complex data with Spider Charts, each visualization Mod brings a new perspective to your data analysis and extends your Spotfire visualization capabilities. We’re grateful for the engagement and excitement the series has generated.
As visual data science continues to evolve, so does Spotfire. That's why we're thrilled to introduce a new blog series (From Data to Decisions with Spotfire® Data Science) focusing on our latest offering, Spotfire® Data Science"a robust visual data science platform that combines machine learning, modeling, and advanced data science capabilities tailored to various industries. With this series, we'll explore how organizations can unlock deeper insights and drive greater business impact using capabilities native only to Spotfire® Data Science.
Spotfire® Data Science
Spotfire Data Science is designed for businesses looking to go beyond traditional analytics. By seamlessly integrating visual data science, predictive modeling, and AI-powered insights, Spotfire Data Science empowers users to solve complex mission-critical business challenges across industries.
What makes Spotfire Data Science stand out is its balance of powerful algorithms and intuitive visual interfaces. Data scientists and business users alike can collaborate effectively, leveraging predictive models and simulations to drive informed decisions. From anomaly detection to demand forecasting, the platform offers tailored solutions for your most pressing business questions.
Taking a step back, Spotfire Data Science is built using Spotfire® Analytics as the foundation, including all the functionalities of our "foundational platform," combined with data understanding & preparation, modeling & prediction, process improvement (notably statistical process control and reliability analysis), and a re-visioning of our popular visualization Mods.
Our visualization Mods (now referred to as Spotfire Data Science Add-ons in the context of Spotfire Data Science), previously only accessible for download through the Spotfire Community, are now packaged as a part of our industry-specific solutions native to Spotfire Data Science — including and not limited to specialized visualizations and connectivity for industries such as energy and manufacturing. These Spotfire Data Science Add-ons will be part of our upcoming Spotfire 14.5 Innovation release.
Spotlight on the Well Log Chart: Empowering energy companies
To kick off this new series, we're shining the spotlight on one of our most impactful Spotfire Data Science Add-ons, the Well Log Chart, which will be available in Spotfire Data Science with the upcoming 14.5 Innovation release. Designed specifically for the energy sector, this premium module brings unparalleled clarity to subsurface analysis and well planning.
Spotfire Well Log Chart
Visualize and analyze with precision
Energy companies rely on accurate well log data to make critical decisions about exploration, drilling, and production. The Well Log Chart allows you to visualize complex subsurface data intuitively, combining depth-based measurements from multiple sources into a single, interactive view:
- Multi-source integration: Combine data from geological surveys and core samples with open and cased-hole logging tools into one comprehensive analysis.
- Interactive visualization: Easily manipulate views to identify trends, detect anomalies, and validate geological models — from formation evaluation and correlation to reservoir characterization, such as porosity, permeability, and water saturation.
- Real-time insights: Monitor rig metrics during drilling and completions in real time, detecting issues before they escalate.
- Multiple data types and formats: Continuous gamma ray measurement, categorical formation tops, or core samples data present multiple data types and formats in one comprehensive well log visualization
Reduce risk and maximize production
Making confident decisions in the energy sector means understanding subsurface conditions accurately. With the Well Log Chart, geologists and engineers can:
- Enhance reservoir understanding: Identify reservoir boundaries, porosity, and fluid content.
- Optimize well placement: Ensure maximum production by strategically positioning wells.
- Minimize operational risks: Proactively detect drilling challenges and adjust plans in real time by comparing data from different wells.
Accelerate decision-making
By integrating the Well Log Chart into Spotfire Data Science, energy companies can accelerate decision-making processes. Instead of waiting days for static reports, teams gain immediate access to actionable insights, streamlining exploration workflows and reducing downtime.
Stay tuned
In the coming months, we'll dive deeper into the Spotfire Data Science Add-ons. From advanced forecasting tools to AI-driven anomaly detection, this newest offering from Spotfire is designed to help you solve industry-specific challenges and increase your speed-to-insight like never before.
Stay tuned as we explore how Spotfire is helping organizations transform data into smarter decisions. And if you're eager to experience the power of the Well Log Chart firsthand, reach out to us for a personalized demo.
Welcome to the next chapter of visual data science with Spotfire! Register now to learn about our upcoming Spotfire 14.5 Innovation release"don't miss our webinar on the topic.