
Visualizing trends with the Spotfire® Area Chart Mod
Understanding trends in data is crucial for making informed decisions. Whether tracking revenue growth, analyzing market trends, or monitoring resource consumption, clear and engaging visualizations help bring insights to the forefront and increase speed-to-insight for data-driven decision making. The Spotfire® Area Chart Mod enhances your ability to analyze and communicate trends over time, providing an intuitive way to represent cumulative data changes.
What is the Area Chart Mod?
The Area Chart Mod is a powerful addition to the Spotfire suite of custom visualizations available on the Spotfire Community. It extends the functionality of standard line charts by filling the area beneath the line, making trends easier to interpret, and driving a clearer understanding of your data. This Mod is particularly useful when analyzing time series data, stacked contributions, or cumulative distributions.
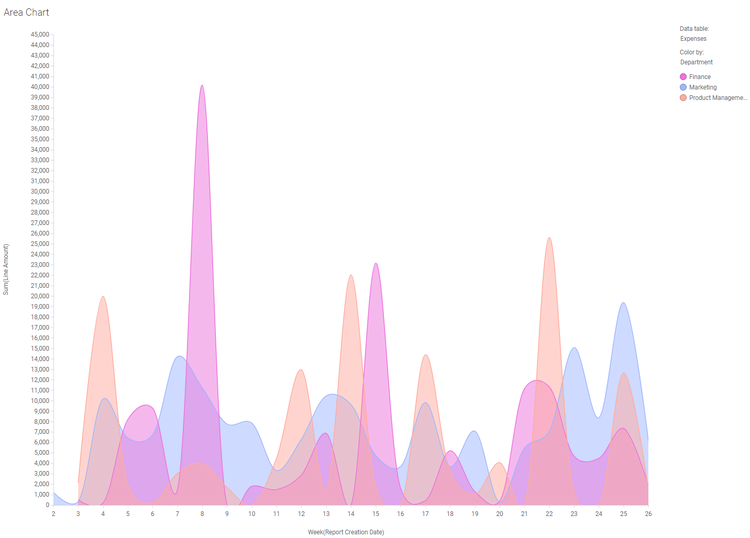
Spotfire® Area Chart Mod
By leveraging the area chart visualization Mod, you and your teams can effectively highlight trends, compare multiple categories, and visualize the relative magnitude of data changes over time.
Key features and benefits of the Area Chart Mod
- Enhanced trend analysis: The filled areas emphasize fluctuations and long-term patterns, making it easy to spot growth or declines in your data.
- Stacked and overlapping areas: Visualize contributions of different categories to the whole, ensuring a clear breakdown of component trends.
- Customizable appearance: Adjust colors, transparency, and line styles to create visually compelling reports that align with your brand or analysis needs.
- Interactive data exploration: Leverage Spotfire interactive filtering and marking capabilities to drill down into specific data points and refine your insights.
Use cases across industries
The versatility of the Area Chart Mod can be extended to all industries, and a wide range of use cases:
- Finance & business analytics: Track revenue growth, profit margins, or stock performance over time, with clear visual distinctions between different categories.
- Marketing & customer engagement: Analyze website traffic, customer acquisition trends, and campaign performance with an intuitive, layered visualization.
- Supply chain & operations: Monitor production output, resource utilization, or logistics performance with stacked area charts to understand cumulative impact.
- Energy & sustainability: Visualize energy consumption trends, renewable energy contributions, or carbon footprint reductions in a clear and digestible format.
Getting started with the Area Chart Mod
Integrating the Area Chart Mod into your Spotfire environment is quick, and straightforward:
- Download the Mod: Access the Area Chart Mod from the Spotfire Community Exchange.
- Install and load data: Follow the installation steps and ensure your dataset is structured appropriately for time series or category-based analysis.
- Customize your chart: Adjust settings like colors, stacking options, and transparency levels to align with your visualization goals.
- Explore & share insights: Use interactive filtering and marking to gain deeper insights and present your findings in a compelling way.
For more detailed guidance, visit our dedicated Spotfire Community article on this featured visualization Mod.
The Spotfire Area Chart Mod enhances data storytelling by providing a visually engaging way to track trends and analyze category contributions over time. Whether you're a business analyst, data scientist, or operations manager, this Mod empowers you to uncover deeper insights and communicate findings effectively.
Download the Area Chart Mod today and start transforming your trend analysis, and be sure to check out our latest Mods in our Mods library.