
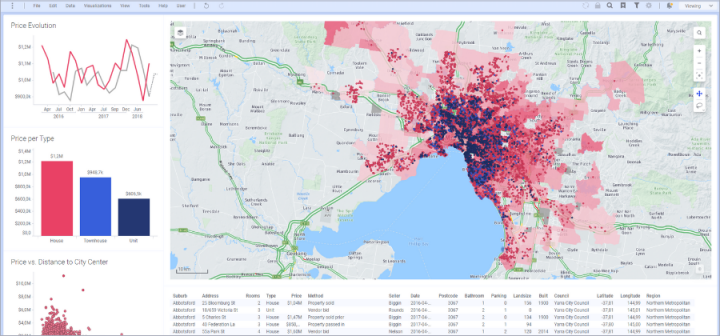
More than a map: Discover the hidden features of Spotfire geoanalytics
Geoanalytics, also called location analytics or geospatial analytics, simply refers to location-based analysis that gives geographical context to data. By incorporating geospatial data into analysis, a business can understand logistics, predict weather patterns, identify geological conditions, optimize routes, monitor workers in transport, and so much more. An added benefit is that maps are often easier for multiple users to understand than just charts and functions.
Common geoanalytics use cases
Every industry can benefit from map-based information and analysis. Maps provide a wealth of visual information that can be digested easily by experts and non-analytics users alike. Companies that use geoanalytics to optimize their business strategies can decrease costs, locate new opportunities, and improve operational efficiency.
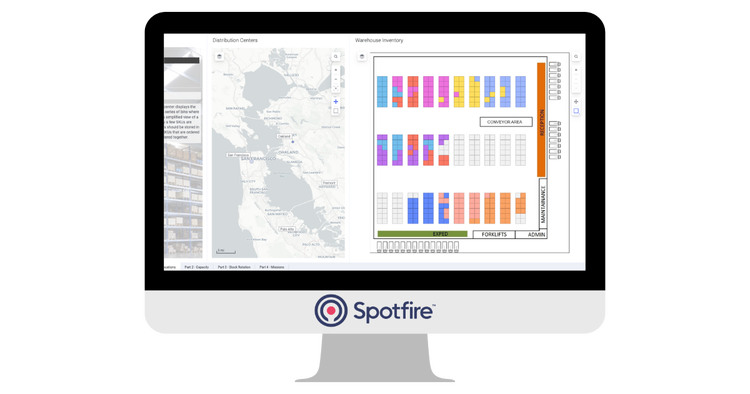
Spotfire Supply Chain Demo: Spotfire map of warehouse inventory compared to distribution centers
Manufacturing and energy: Resource management
With geoanalytics, manufacturers and energy companies can monitor plants and factories across regions, predict areas most vulnerable to outages due to weather or natural disasters, and proactively position maintenance teams in those areas. Field-based teams can be tracked for safety and monitoring along with remote equipment, such as off-shore drilling rigs.
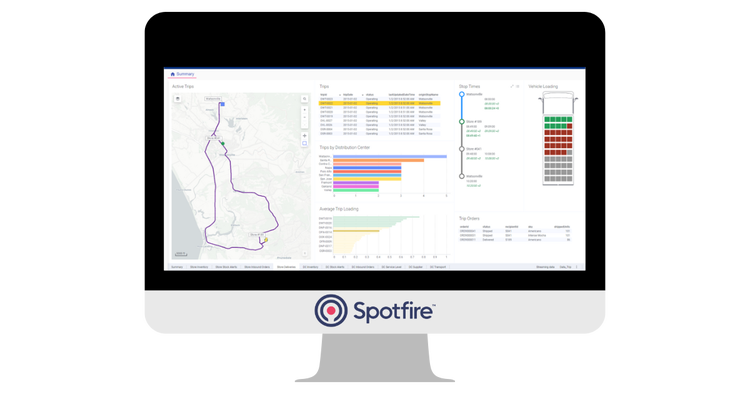
Spotfire Continuous Supply Chain Accelerator: Spotfire map of real-time routing, downloadable on the Community
Logistics and transportation: Supply chain management
Combining customer shipment data with external geo-related data allows transportation providers to predict potential shipping delays, address logistic issues before they occur, and reduce supply chain bottlenecks at the source. Overlays with weather patterns or traffic data can inform of potential delays or disruptions as well.
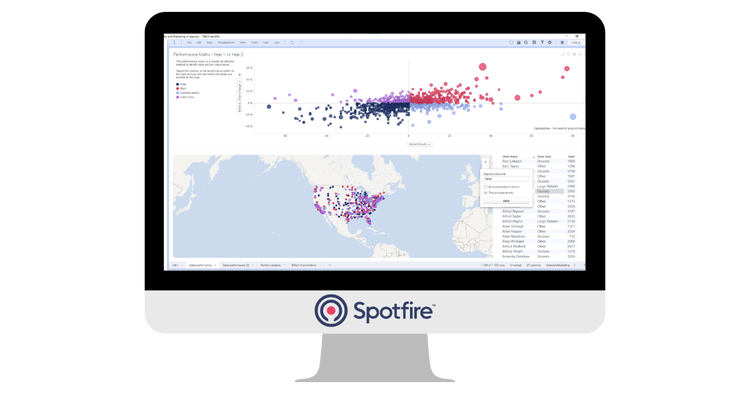
Spotfire Heart Disease Prevalence Demo: Spotfire map that shows the prevalence of heart attacks in the US
Healthcare and life sciences: Disease prevention and management
Map-based data about patients or the environment can help inform about sudden outbreaks, disease trends, regional health factors, and more. If certain areas are affected by a disease faster, whether in humans or wildlife, scientists and doctors alike can dig into the data to see which factors might be the culprit and prevent outbreaks in the future.
Geoanalytics in Spotfire
Spotfire® visual data science is a leader in advanced geoanalytics — using multiple functions and calculations to display precise geographical data. Spotfire map charts display multiple layers of information that can be rearranged and made transparent, including points, lines, polylines, and other layers that can show geology, live weather, terrain, or other pertinent information.
Some other features of Spotfire maps:
- Each layer can be configured to only be visible at certain zoom levels. For example, a map can be configured so that as you zoom in, new layers become visible and other layers disappear."
- Map layers with points, lines, and other objects can be configured to respond to marking." Points, lines, or WKB objects on a map that are marked and refreshed by a data function provide a convenient round-trip means of interacting with data and calculations using the map interface."
- Use algorithms written in R, Python, or Spotfire® Statistica to perform calculations both within and between your map’s data layers.
- Download from a growing library of templates that include Spotfire® Statistica functionality like interactive contour lines, heatmaps, polygons, territory calculations, and route optimization.
Uncover location-based insights
Want to see all the geoanalytics capabilities of Spotfire? Check out the Spotfire Community for more in-depth information on how to get started and access to map-based extensions.