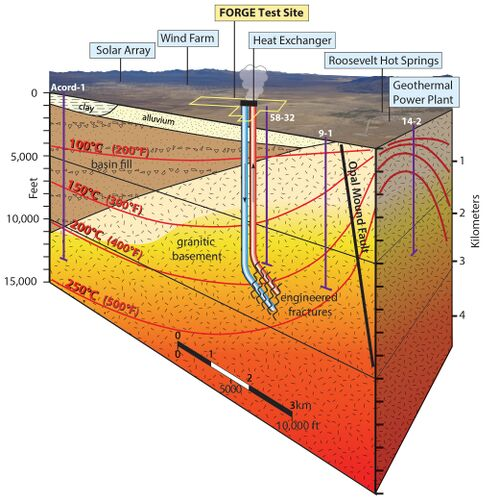
The 2025 Spotfire Energy Forum Community Hackathon recently took place from May 6th to May 13th, 2025, where participants were tasked with finding the perfect spot to drill the next geothermal well in the UFORGE Project. This international field laboratory, managed by the Energy & Geoscience Institute at the University of Utah and sponsored by the Department of Energy, aims to develop and optimize methods for creating enhanced geothermal systems.
The challenge
The challenge was unique with participants having to navigate through numerous datasets, including temperature and pressure logs, groundwater monitoring data, well data, seismic observation data, and more. The biggest hurdle was finding the right dataset to use within the given timeframe and answering the question of where to drill the next well.
Participants had the freedom to use any Spotfire version and were judged on innovation and creativity, visual storytelling, interactivity and user experience, and impact and real-world vitality. The Hackathon showcased the power of data analysis and visualization in driving decision-making in the energy industry, demonstrating the potential of geothermal energy as a clean and scalable solution for the future.
We’re excited to see how data-driven insights can drive innovation in this field. Learn more about the winning submissions below.
The winners
1st place: Mario Ortiz-Torres
First place submission
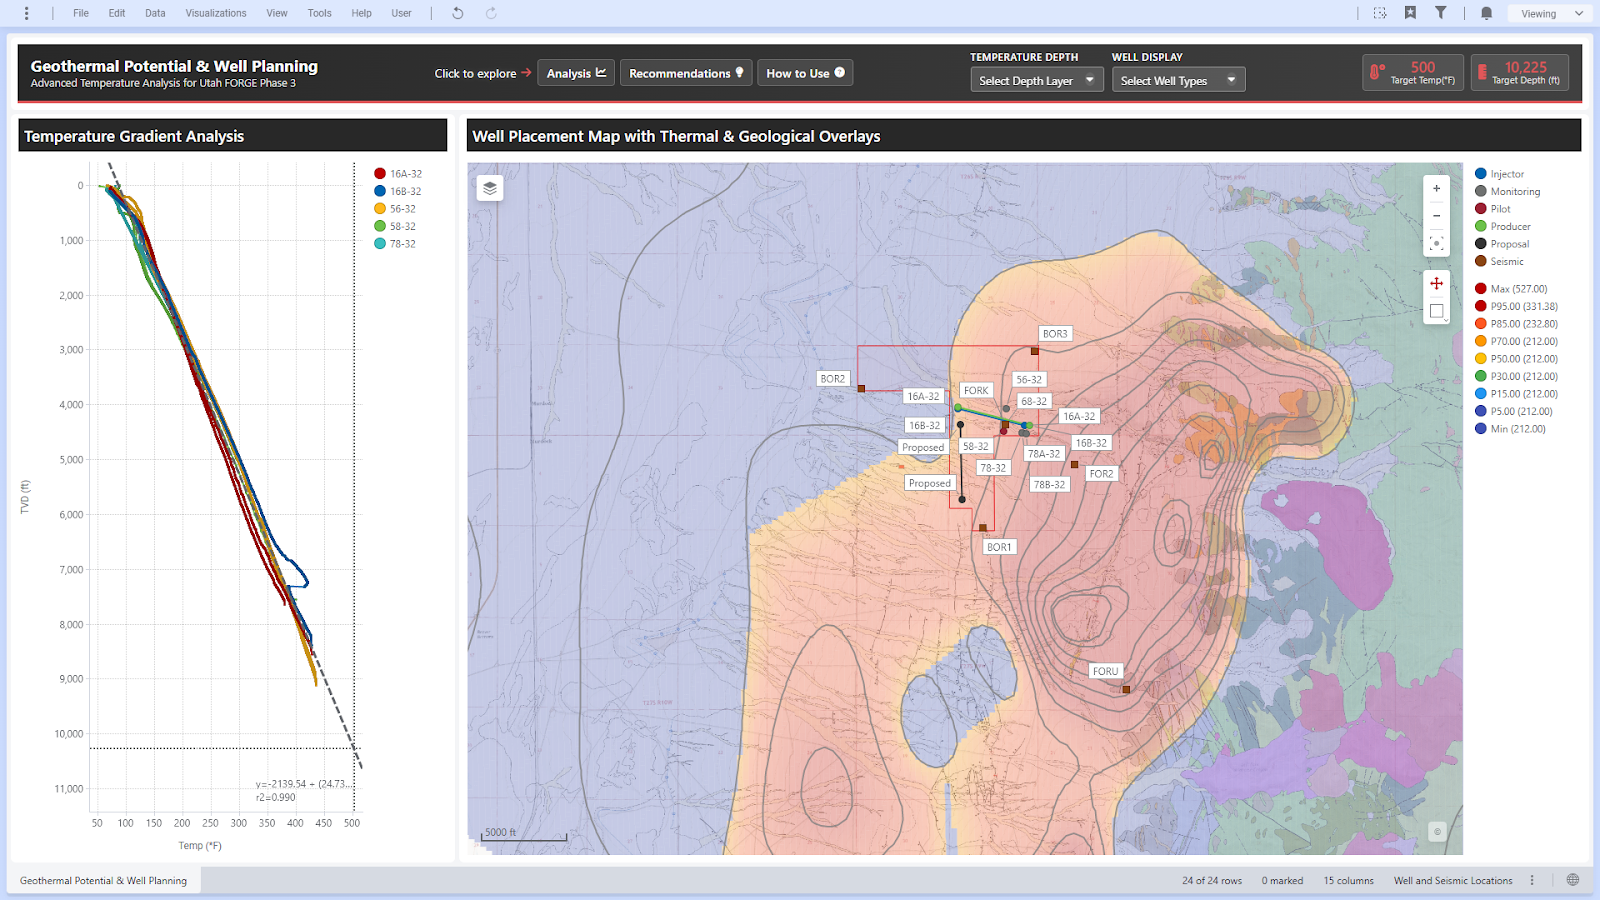
The winner of the Hackathon was Mario Antonio Ortiz-Torres with his innovative solution, “Optimal Geothermal Well Location: Data-Driven Analysis for Utah FORGE’s Next Well.” Mario’s approach combined multiple technical disciplines, including data integration and cleaning, enhanced TVD calculation, and thermal gradient analysis.
Grading criteria comments:
- Innovation and creativity: Mario’s use of Python interpolation script to calculate TVD and his approach to validating contour data demonstrate high levels of innovation and creativity.
- Visual storytelling, quality of execution, and presentation: The solution provides clear and concise visualizations, and the presentation effectively communicates the approach and findings. Mario managed to tell a story with only one page. He leverages his work by using popups and JavaScript components.
- Interactivity, functionality, and user experience: The analysis demonstrates a clear understanding of the data and the ability to interact with it, rich in functionality and an easy-to-navigate user experience.
- Impact and real-world vitality: The solution directly supports the objectives of the Utah FORGE project, providing a data-driven approach to determining the optimal well location. After some research from additional Utah Forge resources, Mario had a good problem statement and detailed key findings for this project.
Key findings:
- The hottest region at target depth will be positioned northeast of where single-depth analysis would suggest.
- The temperature increases linearly with depth in the FORGE region, with a target temperature of 500°F projected at approximately 10,200 ft TVD.
- The recommended well location balances temperature optimization with practical constraints, including surface infrastructure, drilling engineering, and regulatory considerations.
Conclusion:
Mario’s solution demonstrates a thorough understanding of the data and the technical requirements of the challenge. His approach provides a clear and concise recommendation for the optimal well location, aligning with the objectives of the Utah FORGE project. Congratulations to Mario on his win!
Check out his work here.
2nd place: Martin Lozano
Second place submission
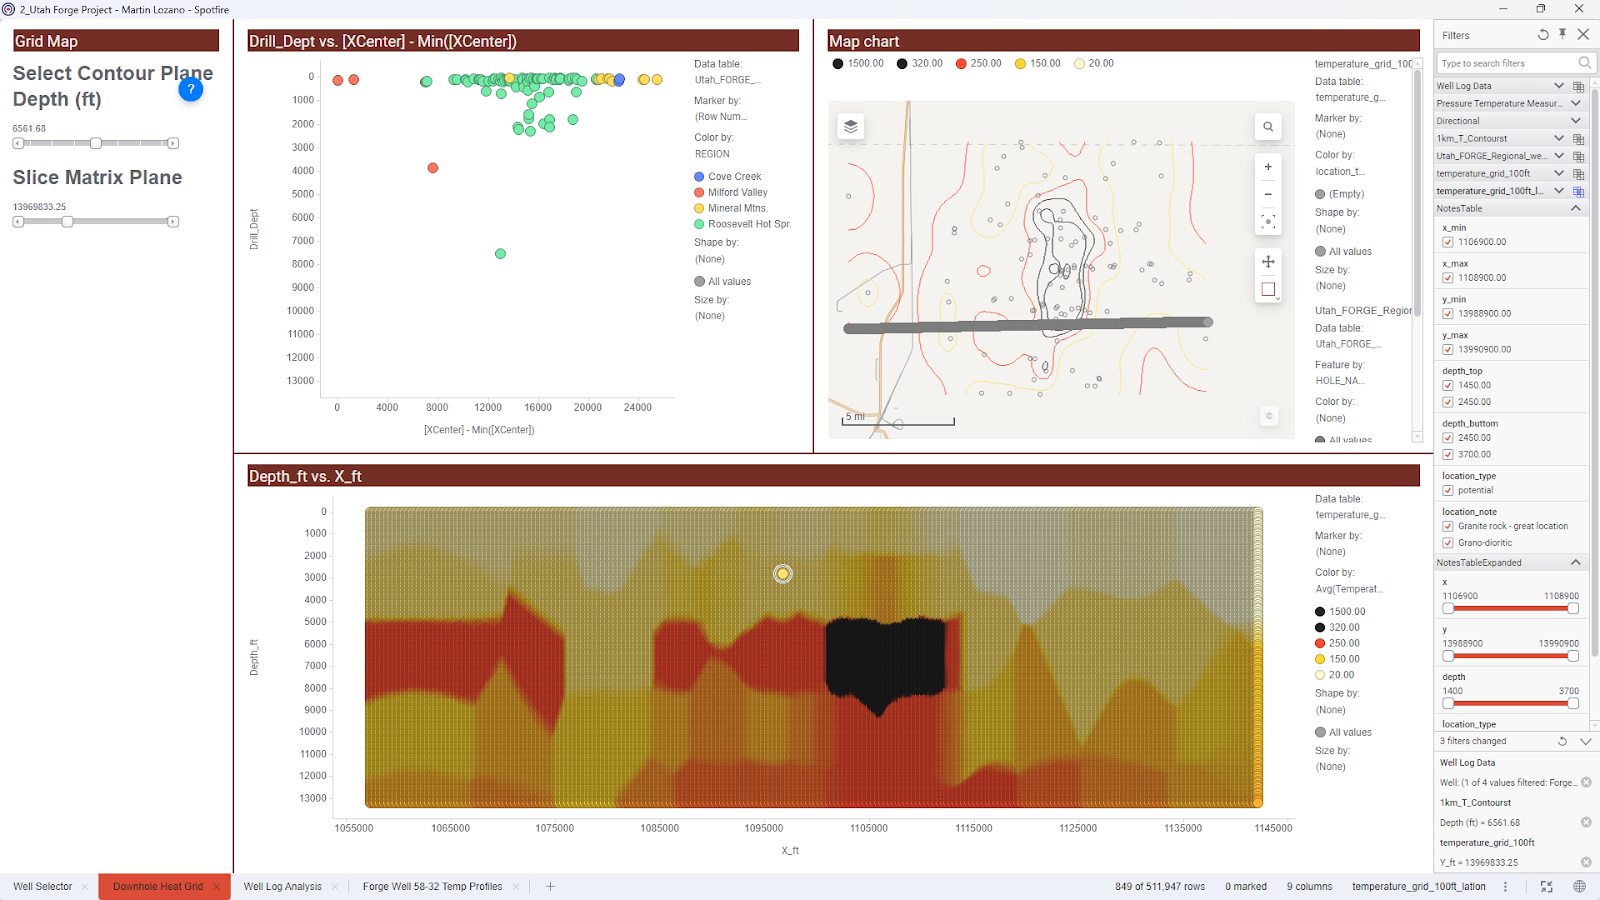
This submission by Martin Lozano presents an interactive Spotfire project for geothermal well planning in the Utah Forge Project. The project utilizes public data sets and demonstrates the use of Spotfire for more than visualization, including database creation and note-taking. It was neat to have his presentation with embedded videos explaining the dashboard and his thought process.
Key features:
- Interactive heat grid creation with temperature interpolation
- Note-taking functionality using visualizations and markings
- Ability to link heat grid to well set and visualize heat profile if deepened
- User-friendly interface with slicer visualization for temperature at different planes
- 3D heat grid creation with temperature interpolation
- Cross-section feature for analyzing well viability
Technical details:
- The 3D heat grid is created using inverse distance squared weighting and KD-tree interpolation.
- The database is generated using the Spotfire data function feature.
Grading criteria:
- Innovation and creativity: The submission showcases creative use of Spotfire for geothermal well planning, but the approach may not be entirely novel.
- Visual storytelling, quality of execution, and presentation: The submission presents clear and concise visualizations, but some areas of the presentation could be more polished.
- Interactivity, functionality, and user experience: The submission demonstrates excellent interactivity, with the slider and cross-section feature enhancing the user experience.
- Impact and real-world vitality: The submission has potential impact in the field of geothermal energy exploration and well planning but could be further enhanced by more explicit connections to practical applications and industry needs.
Conclusion
This submission demonstrates the potential of Spotfire in geothermal energy exploration and well planning. The interactive 3D heat grid and database features provide a valuable tool for decision-making, and the visualizations effectively communicate the results.
Check out his work here.
3rd place: Jolene Robertson
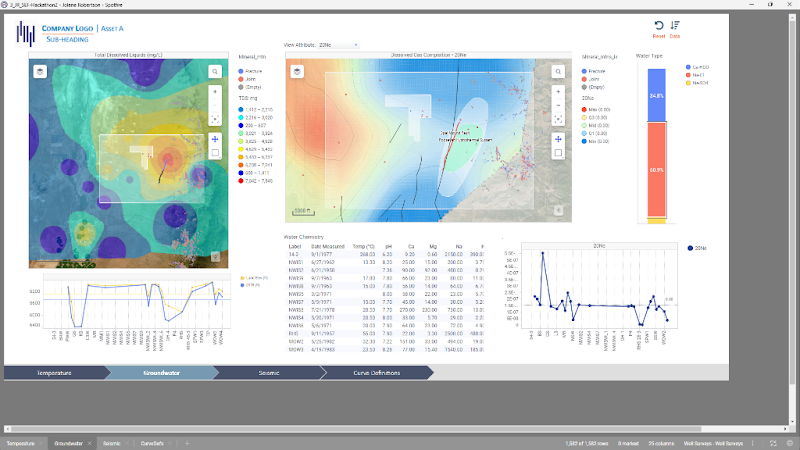
Third place submission
Jolene Robertson’s submission showcases an impressive Spotfire project for geothermal well planning, despite being incomplete due to time constraints. The project demonstrates a clean style and innovative features, including synchronized zoomable scrollbars across multiple visualizations.
Key features:
- Clean and intuitive design
- Synchronized zoomable scrollbars for enhanced exploration
- Innovative use of Spotfire features
Challenges
Jolene mentioned that finding the correct dataset and data cleanup took up approximately 80 percent of her work, highlighting the importance of data preparation in real-world scenarios.
Grading criteria comments:
- Innovation and creativity: The submission showcases innovative features, but the incomplete nature of the project limits its overall creativity.
- Visual storytelling, quality of execution, and presentation: The submission presents a clean and intuitive design, but the lack of completeness affects the overall quality of execution.
- Interactivity, functionality, and user experience: The synchronized zoomable scrollbars demonstrate excellent interactivity, but the incomplete nature of the project limits its overall functionality.
- Impact and real-world vitality: The submission has potential impact, but its incomplete nature and lack of explicit connections to practical applications and industry needs limit its real-world vitality.
Conclusion
Jolene’s submission had a clean style and innovative features, showcasing her understanding of Spotfire and its potential applications in geothermal energy exploration and well planning.
Check out her work here.
Join the fun at the Spotfire Community
Thanks to everyone who submitted to the Hackathon this year! We loved seeing all the creativity in designing sustainable energy solutions for the future.
Want to learn more about Spotfire from other experts? Join our Spotfire community, where you can ask questions in the forums, read knowledge base articles, download files from the Exchange, and much more. Be sure to check out our educational program, Dr. Spotfire, for more tips and tricks.
Want to give this challenge a try? You can still submit your work to our team using this form (no prizes will be awarded). Check out the Hackathon Community Article for complete details and start cooking your next killer app with Spotfire and the Utah Forge dataset included in the article.