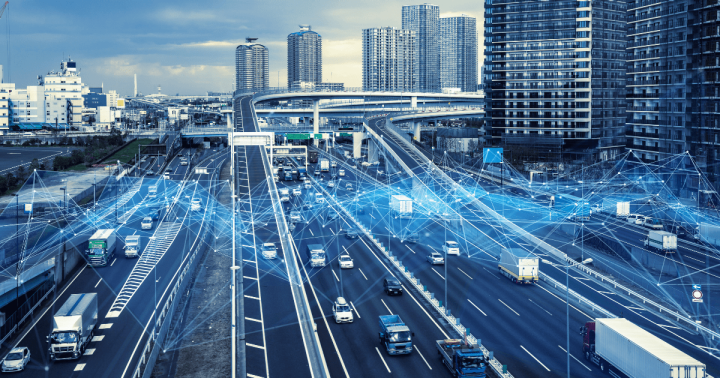
Machine learning and AI to process streaming video data in traffic webcams
Nobody loves traffic, except maybe data scientists.
In the short video below, the Spotfire team shows how a public video feed can be combined with some clever computer vision and streaming data science to track, classify, and analyze vehicle traffic.
This simple and replicable solution can minimize traffic jams, support traffic calming efforts, and optimize existing infrastructure — at a fraction of the cost.
This same approach can be replicated across many other applications, from airport security to farm management to factory safety. All that's needed is a streaming video source and Spotfire software.
Traffic calming using existing streaming video
Tracking, analyzing, and acting on traffic data has traditionally required expensive pressure sensors placed on the road or other costly and inconvenient solutions. Using a single publicly available video feed, the video's solution generates the same insights and automated alerts. These include:
- The number of vehicles passing during any period of time
- The number of vehicles above or below the speed limit
- A measure of the average speed of buses, trucks, or cars
- Congestion analysis
- Alerting drivers of possible delays
- Alerts regarding any vehicles that may be excessively speeding
- Additional insights to construct traffic easing solutions, both in real time and long-term
The methodology
Here's the step-by-step process used by the Spotfire team:
- Access an available public streaming video feed. In this example, it's a webcam showing a section of raised road in front of the iconic Sydney Harbor Bridge.
- Use OpenCV to grab the image and convert it from streaming video to streaming data.
- Put this data through a TensorFlow Neural Network, which evaluates and classifies each vehicle. Note: We trained this network by first identifying different vehicles manually. A neural network is an algorithm for machine learning meant to mirror how neurons in the human brain work.
- A Deep SORT algorithm was then used to track the movement of the vehicles over the designated space.
- Build logic to identify a point in time to make it practical to count each vehicle and capture its image automatically. Vehicle image information includes speed, class of vehicle, and direction, which provides additional insight. This is published to Apache Kafka and then sent to TIBCO Steambase to clean, format, and store the data.
Spotfire is used to display the analysis. Unlike other visualization tools, Spotfire can handle and display streaming data with real-time changes.
Streaming data enables countless new opportunities
Internet-enabled devices, including sensors, cameras, purpose-built microchips, and other gadgets, continuously collect and transmit massive amounts of streaming data. Now, they can be used to create multiple new opportunities and even spur new business models. A few examples include:
- Airports can use real-time video data to maintain security, send alerts, and promote more effective movement of people throughout the complex. Spotfire is already used at a major European airport to monitor and control passenger flows.
- Farmers can use drone video and machine learning to gain real-time information about crops or the number of cows in the field — including analyzing their age and health.
- A warehouse operator can use webcams that push alerts if anyone gets too close to automated machinery.
- Logistics operators can track all their moving assets, including trucks and cargo, or push alerts to the fleet regarding potential road incidents or delays.
Ultimately, this example shows how anyone can take streaming data and create immersive real-time dashboards to visualize what's happening — and even leverage automated case management tools to respond in real time. There are no limits to possible use cases.
Learn how to unlock the many valuable insights inside your video feed.