What is data science?
Data science is a multidisciplinary approach to finding, extracting, and surfacing patterns in data through a fusion of analytical methods, domain expertise, and technology. This approach generally includes the fields of data mining, forecasting, machine learning, predictive analytics, statistics, and text analytics.
As data is growing at an alarming rate, the race is on for companies to harness the insights in their data. However, most organizations are faced with a shortage of experts to analyze their big data to find insights and explore issues the company didn’t even know it had. To realize and monetize the value of data science, organizations must infuse predictive insights, forecasting, and optimization strategies into business and operational systems. Many businesses are now empowering their knowledge workers with platforms that can help them conduct their own machine learning projects and tasks. Being able to extract trends and opportunities in the massive amounts of data being infused into a business will give an organization a competitive advantage.
Data science includes descriptive, diagnostic, predictive, and prescriptive capabilities. This means that with data science, organizations can use data to figure out what happened, why it happened, what will happen, and what they should do about the anticipated result.
Understanding how data science works
Conceptually, the data science process is very simple to understand and involves the following steps:
- Understand the business problem
- Gather and integrate the raw data
- Explore, transform, clean, and prepare the data
- Create and select models based on the data
- Test, tune, and deploy the models
- Monitor, test, refresh, and govern the models
Understand the business problem
The process of data science starts with understanding the problem that the business user is trying to solve. For instance, a business user might want to ask and understand “How do I increase sales?” or “What techniques work best to sell to my customers?” These are very broad, ambiguous questions that don’t lead to an immediately researchable hypothesis. It is the data scientist’s job to break these business problems down into researchable and testable hypotheses. For instance, “How do I increase sales?” could be broken down into several smaller questions such as “What conditions lead to the increased sales? Was it a promotion, weather, or seasonality?” “How can we optimize our sales based on constraints?” and “What are the sales likely to be tomorrow/next week/next month for each store?” The important thing to remember is that one needs to understand the business decision that needs to be made, and work backwards from there. How will your business process change if you could predict something an hour/day/week/month into the future?
Gathering and integrating the raw data
Once the business problem is understood, the next step involves gathering and integrating the raw data. First, the analyst has to see what data is available. Often, data will be in many different formats and many different systems so data wrangling and data prepping techniques are often used to convert the raw data into a useable format suitable for the specific analytic techniques that will be used. If the data is not available, data scientists, data engineers, and IT generally collaborate to bring new data into a sandbox environment for testing.
Explore and prepare the data
Now, the data can be explored. Most data science practitioners will employ a data visualization tool that will organize the data into graphs and visualizations to help them see general patterns in the data, high-level correlations, and any potential outliers. This is also the time when the analyst starts to understand what factors may help solve the problem. Now that the analyst has a basic understanding of how the data behaves and potential factors that may be important to consider, the analyst will transform, create new features (aka variables), and prepare the data for modeling.
Test, tune, and deploy models
This is the point when most analysts will use algorithms to create models from the input data using techniques such as machine learning, deep learning, forecasting, or natural language processing (aka text analytics) to test different models. Statistical models and algorithms are applied to the dataset to try and generalize the behavior of the target variable (for example, what you’re trying to predict) based on the input predictors (for example, factors that influence the target).
Outputs are usually predictions, forecasts, anomalies, and optimizations that can be displayed in dashboards or embedded reports, or infused directly into business systems to make decisions close to the point of impact. Then, after the models are deployed into the visualization or business systems, they are used to score new input data that it has never been seen before.
Monitor, test, refresh, and govern the models
After the models are deployed, they must be monitored so they can be refreshed and retrained as data shifts due to changing behavior of real world events. Thus, it is imperative that organizations have a model operations strategy in place to govern and manage changes to production models.
In addition to deploying models to dashboards and production systems, data scientists may also create sophisticated data science pipelines that can be invoked from a visualization or dashboard tool. Oftentimes, these have a reduced and simplified set of parameters and factors that can be adjusted by a citizen data scientist. This helps address the skills shortage mentioned above. Thus, a citizen data scientist, often a business or domain expert, can select the parameters of interest and run a very complex data science workflow without having to understand the complexity behind it. This allows them to test different scenarios without having to involve a data scientist.
In summary, data scientists tell a story using data and then provide predictive insights that the business can use for real world applications. The process used, as shown in the graphic below, is:
- Input data
- Prep data
- Apply machine learning
- Deploy, score, and manage models
- Output data
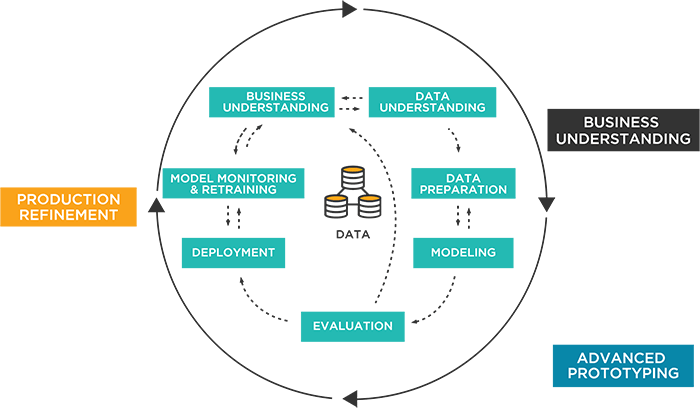
Key steps in the data science process
Business understanding
- Understand the business decision to be made
- Determine what data is needed to make the decision
- Realize how your business will change as a result of the decision
- Determine the architecture needed to support the decision
- Assemble a cross-functional technical and project management team
Understand the machine learning process
- Data acquisition and integration
- Data exploration, preparation, and cleansing
- Data preprocessing, transformation, and feature generation
- Model development and selection
- Model testing and tuning
- Model deployment
Understand the model operations and governance process
- Model repository, documentation, and version control
- Model scoring, API framework, and container strategy
- Model execution environment
- Model deployment, integration, and results
- Model monitoring, testing, and refresh
What skills are needed for data science?
Business Skills: Collaboration, teamwork, communication, domain expertise/business knowledge
Analytics Skills: Data prep, machine learning, statistics, geospatial analytics, data visualization
Computer Science/IT Skills: Data pipelines, model deployment, monitoring, management, programming/coding
Who uses data science?
“The Hidden Talent” aka Citizen Data Scientists: Use data and analytics on a daily basis to solve specific business problems with a point-and-click interface.
“The Business-driven”: Focus on business unit-led initiatives and improving business operations.
“The Specialists”: Work across all functions and business units to solve problems and collaborate with IT to operationalize machine learning models. Attain buy-in and funding from executives.
“The Hotshots”: Leverage a multitude of data sources to solve new problems, prototype solutions using machine learning, and run data science workflows at scale. Favor tools like R, Python, Scala, Hadoop, and Spark.
"The Untapped Potential": Want to jump in, but don’t feel they have the support or training or don’t work for an organization with technology offering reusable templates.
Top data science tasks
- Problem understanding and analysis
- Data collection, data prep/cleaning, and basic exploratory data analysis
- Model development and testing
- Model deployment, monitoring, and governance
- Communication of findings to business decision-makers
What challenges does data science address?
Below are some examples of the challenges that data science is addressing across different industries:
Energy
Data science is mostly being used in the energy sector to optimize exploration, production, and operations while anticipating demands such as:
- Predict equipment failure
- Forecast future oil volumes and prices
- Optimize distribution
- Reduce emissions
- Analyze ground composition
- Characterize reservoirs
Finance and insurance
In the finance and insurance industry, data science is mostly focused on reducing risks, detecting fraud, and optimizing the customer experience. Some examples of where data science is used are:
- Predict credit risk
- Detect fraud
- Analyze customers
- Manage portfolio risk
- Determine likelihood to churn
- Comply with regulations such as SOX, Basel II
Healthcare
Data science in healthcare is mostly used to improve quality of care, improve operations, and reduce costs.
- Predict disease risk
- Detect fraudulent claims
- Prescribe personalized medicine doses
- Analyze images to detect cancers
- Manage claims
- Improve patient safety
- Determine who is most at risk
Pharmaceutical
Data science in the pharmaceutical sector is mainly used to ensure safety, product quality, and drug efficacy such as:
- Determine golden batch
- Analyze clinical trial
- Trace products
- Analyze stability & shelf life
- Validate reporting and analytics for regulatory compliance
- Analyze manufacturing processes, data
Manufacturing
In manufacturing, data science helps optimize processes, improve quality, and monitor suppliers. Some examples are:
- Improve yields
- Reduce scrap, rework, & recalls
- Detect warranty fraud
- Comply with regulations
- Predict & prevent equipment failures
Challenges that data scientists face
Inaccessible data
Addressed by:
- Easily combining data from multiple, disparate sources into a virtual data layer
- Visually manipulating, cleaning, and transforming data to make it ready for analysis
- Using introspection and relationship discovery to understand and validate data relationships for model building
Dirty data
Addressed by:
- AI fueled visual wrangling to automatically suggest transformations, remove outliers, and clean data
- Automated data health check to fill in missing values, remove unimportant variables, and prepare data for analytics
- Formatting and preparing data across disparate sources at scale
Limited talent & expertise
Addressed by:
- Using automated recommendations and visual insights to make sense of complexity
- Harnessing the creativity of the entire team, not just a few data scientists, and collaborating across the end-to-end analytic lifecycle
- Creating reusable parameterized templates that can be run by citizen data scientists to scale machine learning
Results not being used
Addressed by:
- Simplifying deployment to operational systems to embed machine learning into business processes at the point of impact
- Operationalizing data science with model monitoring, retraining, and governance
- Ensuring successful handoffs across the end-to-end analytic lifecycle: data pipeline, model building, scoring, and app development
Solving data science challenges
Data Science for Everyone: Democratize and collaborate on data science with automation, reusable templates, and a common collaborative framework for cross functional teams
Accelerate Innovation: Rapidly prototype new, flexible solutions with native algorithms, open source, and partner ecosystems while ensuring governance
AnalyticOps: Monetize the value of data science by systematically focusing on its operations through pipeline monitoring, management, updating, and governance
Training: Provide education and training to citizen data scientists and others who want to learn data science practices.
Center of Excellence: Establish a CoE to promote best practices and foster innovation and reusability so that data science can be scaled across the enterprise
