What is a treemap chart?
Treemapping is a data visualization technique that displays hierarchical data using rectangles of decreasing sizes, often called nesting, to create treemap charts.
As the name suggests, treemap charts depict data in a tree-like format, with branches and sub-branches that are able to be read at a glance. Treemaps are great at taking a large amount of raw data and depicting it in a visually appealing, compact, and easy-to-read manner, enabling the user to discern patterns and make comparisons rapidly.
It can be tremendously beneficial when simultaneously displaying a magnitude of major categories as well as the sub-categories. They accurately convey part-to-whole relationships, across a complex set of data. Tree maps can be anything from a few layers to dozens of layers deep. They also can allow the viewer to drill down into hundreds of sub-categories.
Characteristics and components of a treemap chart
The following are the defining characteristics of treemap charts
- Data is represented using rectangles.
- Each rectangle represents two numerical values. The rectangles are sometimes referred to as “nodes” or “branches.” The nested datasets within are then referred to as “leaves.”
- The dimensions and plot colors of the rectangles are calculated based on the quantitative variables associated with the respective rectangles.
- The data can be multi-layered: hierarchically organized data is depicted in a set of nested rectangles, with the “parent elements” tiled along with their “child elements.”
- When a quantity is assigned to a category, the area size of the rectangle is proportionate to that quantity.
- The parent category’s area is made up of the sum of its subcategories.
- The rectangles in the treemap are arranged according to size. The standard format is that the rectangles range in size from the chart’s top left corner and flow to the bottom right corner. Therefore, the top left corner of the treemap has the largest rectangle, whereas the bottom right corner of the chart has the smallest rectangle.
- With hierarchical data, i.e. with nested rectangles, the same order is followed, with the lower level rectangles stacked within each higher level rectangle in the treemap. The size and position in the chart of the parent rectangle containing the nested rectangle depends on the sum of the areas of the nested rectangles.
This form of representation makes it easier to distinguish between various categories and to read and interpret a large number of data values far more easily than other formats. Treemaps are a great, space-saving, and efficient way to display hierarchies in data.
Examples of treemap charts and their variants
There are a wide number of ways that a treemap can be used across industries, areas of study, and presentation types:
- Comparing the sales numbers of different brands or models over a certain period can make up a great two-dimensional treemap chart
- Literacy rates within districts belonging to a certain geographic area over a specific period
- Relative population densities of the top 10 highly populated countries
- Inventory of various birds, animals, and fish (including types) in a pet store is the perfect example of a nested treemap chart.
- Below is an image of a treemap chart that uses data referring to sales of electronic items in several cities.
A treemap chart is made up of three main sections:
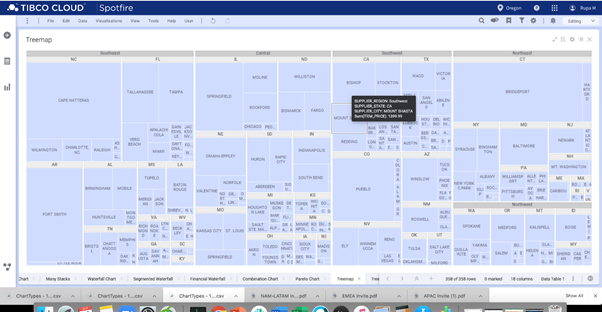
1. The plot area
The body of the visual representation is done here: each rectangle is colored in shades of the highest level category. However, this is only necessary when the treemap represents data alone, and other color variants may also be used when designing treemaps.
The plot area is where visual representation takes place.
2. The chart title
Giving the chart a clear and descriptive name will help your users easily understand the visualization.
3. The legend
The legend is the part of the map that helps distinguish one data series from another and is sometimes represented by a sliding color scale. In a color key type of legend, each color represents one of the highest level categories (branches).
When should a treemap chart be used?
A treemap is ideal when your data needs to be showcased and analyzed in the context of two quantitative values, each unit of which is represented by one rectangle.
Often the dimensions of the rectangle correspond to one aspect of the data, such as the average annual sales figures of an electronics item, while the color of the rectangle can be based on a sliding color scale, depicting the percentage growth in sales that year compared to previous years. This allows the visualization of complex data, with different variables and timeframes presented in an easy-to-understand way.
When you have an enormous amount of data that needs to be squeezed into a limited amount of space, a treemap is a great solution. When it comes to plotting tens of thousands of data points, treemap charts have the edge over other charts frequently used to represent hierarchical data, such as drag-node charts or multi-level pie charts. When the number of data points increases beyond a certain limit, it cannot be accommodated within drag-node or pie charts.
It is easier to read and comprehend linear charts in general compared to circular charts. While a pie chart is circular, the treemap chart is linear, providing a visual and analytical advantage.
Choose a treemap when you require a high-level summary or need to simultaneously look at multiple parameters. A treemap chart identifies trends and patterns between the rectangles or nodes of all the categories represented, in addition to internodal relationships within a single or standalone category.
Advantages of treemap charts
The biggest advantages of treemap charts include:
- The ability to identify patterns and discern relationships between two categories or two elements in a hierarchical data structure. Similarly, sub-structures or sub-elements are represented.
- Utilization of space when rendering tens of thousands of data points, with the ability to drill down as needed.
- Accurately displaying multiple elements at once, including “part to whole” ratios. This makes visualization of data easy.
- Uses size and color keys to visualize various attributes. Categories and subcategories can be color-coded to match the parent categories. For instance, electronics sales in different branches would be shades of blue, while furniture sales could be shades of yellow.
Limitations of treemap charts
Like every chart type, there are limitations and times when other chart types should be used:
- A treemap chart does not accommodate data sets that vary in magnitude.
- All values of the quantitative variable that represents the size of the rectangle have to be positive values. Negative values are not acceptable.
- Since the data points are depicted in the form of rectangles with no other sorting options, it follows that they take up space. In addition to the spatial constraint, readability can be a little more difficult as it is easier to read long and linear data plots than wide and large ones. This also makes it difficult to print the treemap.
- Some treemaps take a lot of effort to generate, even with specialized programs.
- Sometimes treemaps do not display hierarchical levels as sharply as other charts used to visualize hierarchical data, such as a sunburst diagram or a tree diagram.
Despite all of these limitations, treemaps are one of the most visually evocative tools to represent data and provide information on aspects that are hard to capture using other chart forms, making them an indispensable tool in data analysis.
