What is a Marimekko chart?
A Marimekko chart is a graphical representation that uses stacked bar graphs of varying widths to visualize categorical data. A Marimekko chart is also known as the mosaic plot, or simply, Mekko charts. They are ideal for representing categorical sample data.
For example, the chart below shows the admission data for a university. The data is categorized into male and female applicants. In each category, the green block shows the percentage who were accepted, and the red block shows the percentage of those who weren’t accepted.
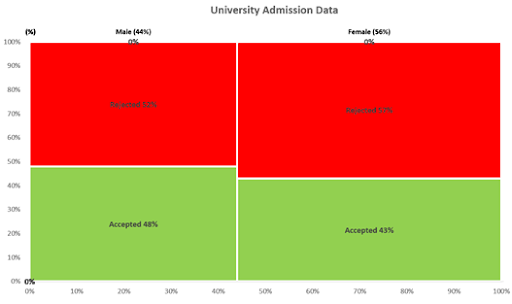
The horizontal axis is divided into two categories: 44 percent male applicants and 56 percent female applicants. Again, each of these categories is divided into two over the vertical axis. The vertical axis represents the percentage of male applicants who were accepted (48 percent) and rejected (52 percent). In more complex charts, each axis might represent more than two categories.
How to construct a Marimekko chart from a contingency table
Marimekko charts combine multiple categories across the vertical and horizontal axes. They are often created based on a contingency table. A contingency table displays a particular frequency in each cell, the intersection of two or more categories.
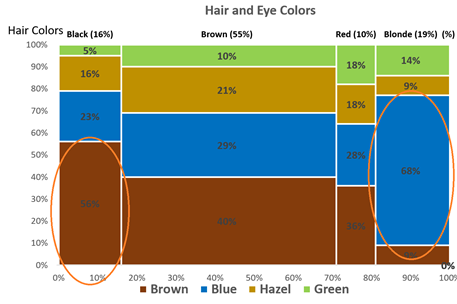
In the example below, we have a contingency table that displays the intersection of two categorical variables: eye color and hair color. The rows represent eye color, and the columns represent hair color. Each cell represents the number of people (frequency) with a specific combination of eye and hair color.

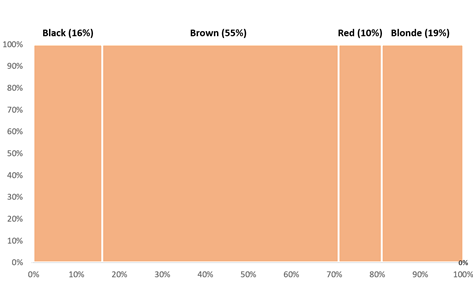
From this contingency table, we can create a Marimekko chart. The vertical axis represents the hair color, and the horizontal axis represents the eye color. Then, calculate what the proportion of each hair color is to the total number of people.
- Black hair = 18/113 = 16 percent
- Brown hair = 62/113 = 55 percent
- Red hair = 11/113 = 10 percent
- Blonde hair = 22/113 = 19 percent
Divide the vertical axes into four categories representing each hair color. The width of each category is directly proportional to the percentage of people having that particular hair color.
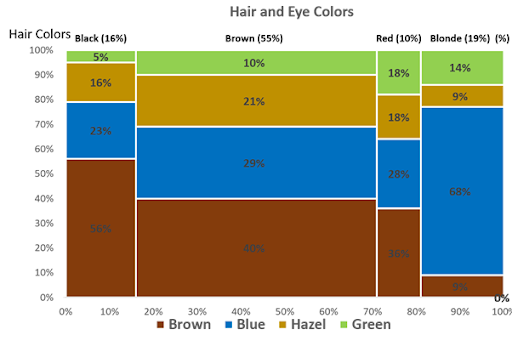
Each of these vertical segments is divided based on eye color. Among the group of people with black hair, 56 percent have brown eyes, 23 percent have blue eyes. Hazel and green eyes are 16 percent and 5 percent, respectively. For the other hair colors, the percentages are calculated similarly. Then each vertical category is divided horizontally to form the blocks or mosaics in the chart. The final Marimekko chart that represents eye and hair colors is shown below.
How to interpret Marimekko charts
While Marimekko charts are great to represent categorical data with multiple subcategories, reading them may not be straightforward. In the Mekko chart above, the width of each vertical column (that represents the hair colors of people) is not the same. Therefore, the height of each block cannot be compared directly. It is the area of each block that correctly represents the value of data. For humans, it is easier to compare heights rather than areas. So, it might be a bit difficult to interpret the Marimekko chart for those unused to this representation.
When should Marimekko charts be used?
To represent sales across multiple stores
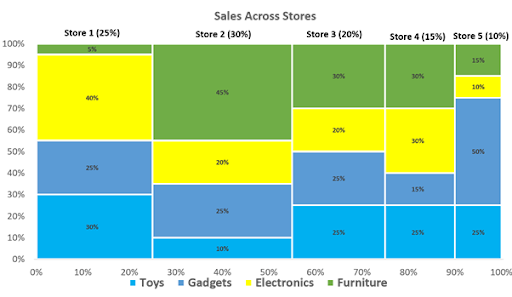
Marimekko charts are an effective tool to help visualize sales data. Assume that a company has a large chain of retail stores across various geographic locations. These stores sell items that belong to different categories: toys, gadgets, electronics, and furniture. A Marimekko chart can represent the categorical data of stores and the items on sale. For example, the chart below shows sales data across a series of stores. The total sales are divided among different stores on the vertical axis. On the horizontal axis, there are different categories. This chart helps to visualize which store made higher sales and which item has the highest sales proportion.
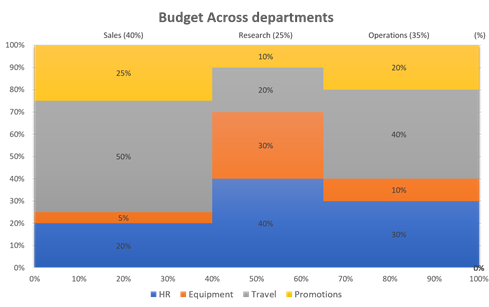
To compare budget breakdowns
Marimekko charts are very useful in visualizing how different departments in an organization assign budgets to various activities. In the chart below, the vertical axis represents departments: sales, research, and operations. The horizontal axis represents how each department has divided its budget across various activities: human resource, equipment, travel, and promotions. It is clear from the chart below that each department’s budget varies according to their functions and roadmap.
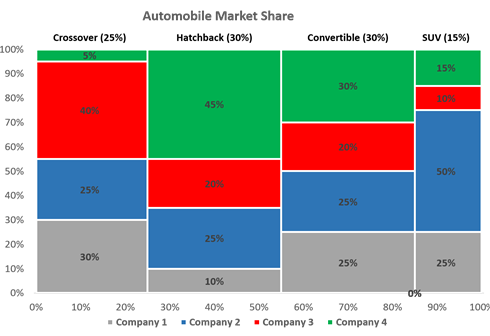
To represent market share across categories
Marimekko charts are often used to represent the share of different companies in a market with multiple segments. The chart below shows the share of different automobile companies in various car segments: crossover, hatchback, convertible, coupe, and SUV.
To represent a skill matrix
Marimekko charts are a great tool to visualize the skill set and the level of expertise needed for different job roles. For example, a Marimekko chart can represent significant job roles and their related skills in a big data organization—for example, data scientist, statistician, developer, and researcher.
What are the common pitfalls when using Marimekko charts?
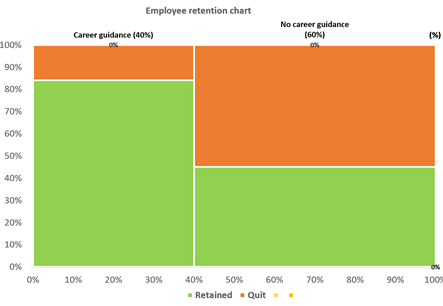
Faulty interpretation due to area comparison
Marimekko charts are interpreted based on the area of each rectangle within the chart. But, each of these rectangles differs in its aspect ratio. It can be difficult to compare the rectangles’ areas to understand which value is higher; for example, the chart below represents the number of employees who remained in the organization after a merger and those who quit in two categories. One is a set of employees who got career guidance before the merger and the other set who has not. The below chart is created to understand the effectiveness of the career guidance program. It is challenging to understand whether the green rectangle on the bottom left or the orange one on the top right is bigger from the below chart. This is caused by the different aspect ratios of the rectangles on a Marimekko chart.
Rectangles are not arranged on a common baseline
In Marimekko charts with multiple categories, the rectangles representing a particular combination of variables aren’t arranged on a common baseline. This means that it is not easy to compare their length. For example, in the chart below, it is hard to compare the heights of the highlighted rectangles, as they don’t have the same baseline.
Too many categories
It is difficult to represent a large number of categories with a Marimekko chart. When there are too many categories on the vertical and horizontal axes, labeling them is difficult. With too many categories, the chart becomes cluttered and difficult to interpret.
What are the charts related to Marimekko charts?
Marimekko charts work well only when there is a limited number of categories. Even though Marimekko charts have great aesthetics, they may not be easy to interpret. There are alternatives to Marimekko charts that are more intuitive.
Bar charts
Bar charts are a great alternative to Marimekko charts. Marimekko charts combine all information into one plot but at the risk of misinterpretation. Multiple bar charts may be required to represent the same data, but each of them provides more clarity. It might be needed to cross-reference the bar charts to interpret the whole data.
Stacked bar chart
Stacked bar charts are suitable for categorical data when the vertical categories have the same proportion. For example, if the number of boys and girls is equal in a class, then the stacked bar chart is more logical than the Marimekko charts.
