What is a geographical chart?
Geographical charts (also referred to as geo charts or map charts) are ideal visualization tools for data that is different for each state, country, or region. A geographical chart shows the reader a heatmap of values spread out over various regions of a map. For example, the population of the United States map could be displayed with denser areas in darker colors and sparsely populated areas in lighter shades of the same color.
As a visual tool, a geographical chart is unlike any other chart in that it is impossible to replace a geographical chart with any other chart. However, in cases where multiple data values need to be represented in a single chart, a bar chart may be used instead of a geographical chart.
Common uses of a geographical chart
A geographical chart can be used in any context where the data is a function of population or of a larger region.
For example, in cases where population attributes need to be studied—such as disease prevalence, safety coverage, the number of schools per million families, or crime rate—a geographical chart is the best visualization technique to use.
While for each chart, only one attribute may be studied, multiple layers can be added to most chart software products to show various features of the same population.
For example, the number of schools, parks, recreational facilities, and health centers in a state can all be studied on the same geographical chart but in different layers.
However, not all geographical charts represent the attributes of a human population. A geographical chart can also be used to study the density of wildlife over time, the rate of depleted forest areas over time, and much more.
A geographical chart can be used in business to study areas for offline stores or access to public transport when picking commercial space. The chart can also represent changes in a region that are not directly dependent on populations at all. For example, coffee production in a region over a period of time can be studied using the layers in a geographical chart.
A geographical chart can be used to observe if the product of a certain crop grows or declines in a region over time, and this can be layered with data on climate change in the region to observe relationships between the two, if any.
How to construct a geographical chart
Every chart building tool will have a different process for creating a geographical chart. However, the idea behind each one is essentially the same. A geographical chart compares various regions on a map with the feature being studied.
Therefore, the region name is usually picked up from one column of raw data, while the other column represents a feature—such as the number of people, the number of hospitals, or the number of restaurants.
One of the most common issues encountered while creating a geographical chart is the misidentification of map areas. Usually, most software products pick up some area names but not all. When this happens, some of the data may not be represented at all. Usually, the only way to fix this is to manually add the data to the map.
However, some software products also allow users to enter a pin code to help identify a region and then enter the corresponding value being represented. However, both these aspects can be tricky when using large volumes of global data.
Types of geographical charts
Geographical charts are classified into various types based on their intended use:
Region geographical charts
Region geographical charts are the most common type of geographical chart. As the name suggests, this chart is used to represent data from different regions on a map.
Marker geographical charts
Sometimes an entire region may not be relevant for representation. Representing a country, when a region is in focus, can be confusing. In such cases, markers or circular, colored spaces are used to represent data. This visualization is similar to a bubble chart with larger or more densely colored markers representing a higher quantity.
Text geographical chart
While this is not a type in itself, text-based labels can be used on a geographical chart to represent additional data.
Heat map geographical chart
On some geographical charts, a heat map of varying intensity can be used to represent data. This is particularly useful when representing data that has some degree of variation that cannot be accommodated by a color gradient alone.
Benefits of using a geographical chart
There is a broad range of applications for a geographical chart, and it is relevant for far more than just academic contexts. Businesses have a lot to gain as well.
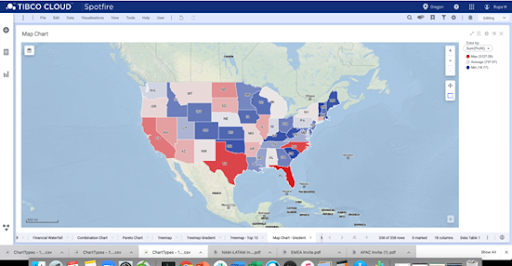
Businesses that expand into new geographies need to study their revenues by region and compare this data with past rates of revenue growth in other regions. For this purpose, a geographical chart is the best solution, offering the ability to zoom into various regions for a granular view or zoom out to see the revenue spread across the globe. The chart below shows the value of electronic goods sales in the United States.
On a geographical chart, connections can be created by drawing lines between two or more points on the map. This is particularly useful when studying logistical data, such as the movement of goods along a global supply chain.
Some geographical charts also contain prisms to represent growth along a third dimension. Going back to the example of revenues by geography, it might be easier to visualize these numbers as a prism of varying heights. Interestingly, a similar analysis is often used to study the spread of votes in a general election.
Challenges when using a geographical chart
Technical challenges often arise when processing such vast swathes of data—and geographical charts are no exception. One of the most common challenges in using a global geographical map is the same issue that flat maps often pose.
Geographical distortion
The earth is spherical, but most geographical charts are flat. This often means that some regions are smaller, larger, or more spread-out on a flat surface than they are on the actual planet. This can sometimes cause problems when using connections on a geographical chart, as the distance between two points may not be entirely accurate.
There are solutions, depending on the chart’s purpose. However, to form the best conclusions, readers should remember that distortion is a problem with flattened global charts.
Color choice
In some countries, different colors have significant meanings. In the USA, red and blue are on the American flag and represent the main two political parties. Choosing agnostic colors is important to avoid preconceptions.
Benefits of a geographical chart
The biggest benefit of a geographical chart is that it is incredibly easy to decipher. It is visually interesting and clearly shows a concept (or set of measurements). It is ideal for businesses when showing geographical areas and their relationships to the organization.
