What is a bubble chart?
Bubble charts, also known as bubble plots or bubble graphs, are used when data needs a third dimension to provide richer information to viewers. A bubble plot is a relational chart designed to compare three variables.
Unlike other three-dimensional charts that process and represent data across three axes (usually x, y, and z), a bubble chart is represented on two axes (x and y), and the size of the bubble communicates the third, vital piece of information.
Of all the charts used to represent data, bubble charts are interesting because of their appearance. Apart from the information represented relationally, bubble charts visualize a critical third dimension, usually not directly dependent on the first two dimensions.
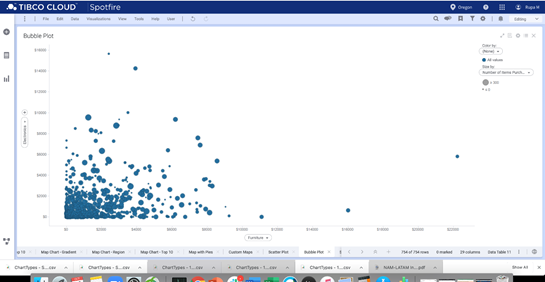
While a standard line graph might show the spend on a certain type of goods (for example, dollar value of electronics sales), bubble graphs include extra information. In the below example, you can see the value of sales in electronics and the value of sales in furniture; the circles represent the number of items purchased.
Bubble charts are good for studying relationships but not for representing exact data. The growth rate of a bubble’s size alone cannot provide accurate information on the rate of quantity growth, but it can provide readers with an estimate and set the context to read the growth rate against the other two quantities.
Why is a bubble chart used?
A bubble chart is most useful for answering a binary question such as whether three variables share a relationship or not. This relationship can highlight a pattern.
For example, a country’s population could be large or small to begin with but grow faster when health and sanitation facilities are available. It also falls rapidly when population control measures are implemented. This scenario would show bubble size increasing over time as infrastructure improved. In this socio-economic example, a bubble chart can help us understand how different parameters move over time.
Bubble charts can also be useful in a business context. In fact, a bubble chart is often used in one of today’s core financial processes: valuation and investments. For example, the cost of valuation can be studied against risk by using the standard axes to represent cost and value and the bubble sizes to represent risk.
Looking at the above graph of sales of electronic and furniture sales, there is a pattern. The challenging aspect of the bubble chart is interpreting the pattern.
How to read and understand a bubble chart
A bubble chart, like every two-dimensional chart, begins with plotting the X and Y axes. Usually, these variables are chosen for a pre-existing relationship or to determine if a relationship does indeed exist between the chosen variables—per our example, the sales of furniture and electronic goods.
The size of the bubble is used to represent the gravity of a parameter. In a population’s context, this is often the population size of each country. In the business context, this can be audience size, potential growth in value over time, store size, or any number of other size-based parameters.
For representing large sets of data that need to be broken down, bubbles of different colors are used to mark differences. For example, the items purchased in American stores could be shown in red, and Oceania stores could be shown in blue. The level of granularity in detail depends on the chart’s purpose. Today, several tools can represent these charts dynamically and show movement in patterns over time.
Every bubble chart can have these features, characteristic of selected data sets. Bubble charts serve to highlight elements such as:
- Outliers: Bubbles on a bubble chart that do not behave like the others on the chart. These outliers provide vital information.
- Gaps: As is the case with other charts, a gap in a bubble chart warrants further investigation to understand if data is missing.
- Clusters: Clusters on a bubble chart are the exact opposite of the outliers. They are groups of bubbles that are around the same, overlapping space on the chart. For example, if multiple geographical regions seem to be clumped together somewhere, it is worth understanding why.
Before identifying and studying these patterns, ensure the data is error-free and that all comparisons are based on data that has been collected using uniform methods.
Using the pandemic as an example, it is safe to assume that the number of positive cases would rise as the number of tests conducted also rises. Therefore, the rise in positive cases per million cannot be plotted without using a bubble to represent the rise in the number of tests being conducted. Applying some simple rules of heuristics to the graph and data can save confusion and uncertainty.
Best practices and common pitfalls to avoid while using a bubble chart
When using a bubble chart, remember that only two dimensions are represented based on concrete data. Since there are two other parameters also being represented, following best practices avoids confusion.
Also, unlike scatter plots that provide more data as the number of points increase, bubble charts can become quickly confusing if they’re used to represent too much data. Bubbles begin to overlap or clump together, causing the reader to draw the wrong conclusions. Hence, on a bubble chart, less is more.
Usually, a bubble chart is not ideal for representing negative values because circles cannot have a negative area. However, empty circles can be used to represent these negative values, and full ones can be used for positive values, if needed. Do note that this is a rare case, and most bubble charts only use bubbles to represent positive values; for example, the population of a country can never be negative.
When used with full knowledge of its limitations, a bubble chart can be a valuable tool to represent data without overwhelming the reader. These charts create fantastic visual impact, but they may not be the clearest or most effective way to share data.
Alternatives to the bubble chart
Scatter plot
A scatter plot is similar in appearance to the bubble chart, but it only measures two variables. For instance, it might only show the value of electronics purchases intersected with the value of furniture purchases. But those two variables plotted don’t show anything interesting or pertinent, which is why the relationship information provided by the bubble plot is useful.
Categorical column charts
Although they look nothing like a bubble chart, categorical column charts are similar in intent. They use bar charts to show the values compared directly, allowing for immediate information that supports far more efficient decision-making. It’s easy to see differences in values and proportions of values.
Cherry chart
This simple-looking chart plots in a similar way to scatter plots, but instead of using a bubble size, they use a “stalk” length as a volume indicator of volume. This presents some similar challenges as a bubble chart with overlapping data making it difficult to see granular data. However, they can give a quick idea of trends and size of effects.
