What is a box plot?
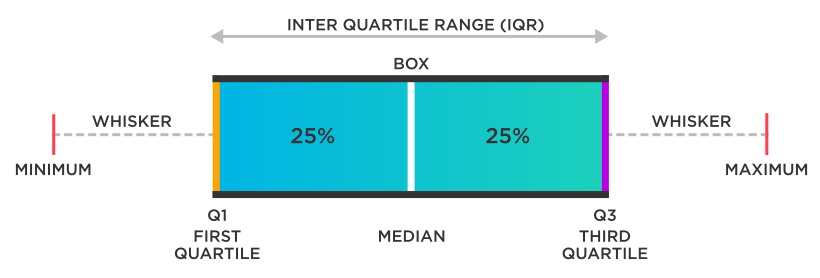
A box plot is a data visualization tool that shows the distribution of data. It is an excellent tool for showing outliers. Also referred to as a box-and-whisker graph or plot, this technique shows relationships between a numerical y-variable and a grouping x-variable by using the five number summary—minimum, first quartile (Q1), median, third quartile (Q3), maximum. Box-and-whisker plots also include a lower adjacent value (LAV), and upper adjacent value (UAV), and interquartile range (IQR). This method is quite effective at illustrating outliers, any points falling outside of LAV and UAV.
Box plots are used to discern, display, and demonstrate graphically how groups of numerical data are localized, spread, or skewed—showing how widely the data values are spread out. This is a way to display this information in an intuitive and space-conserving design. Since the median, spread of data, and total range are obvious, boxplots make distribution variation immediately apparent.
This method of statistical visualization comes under the concept of descriptive statistics. It is used primarily for depicting groups of numerical data in a standardized way, through the data’s quartiles. A quartile, in statistics, is a term that refers to the divisions of data observations into four defined intervals. These four observation intervals are based on the values of the data involved as well as how they compare to the entire set of observations. Simply put, quartiles refer to the values which divide data into quarters or four parts. The first quartile is therefore the 25th percentile, the second is the 50th percentile (also referred to as the median) and so on.
Box plots are an invaluable tool for data analysis and are used to ascertain the following information:
- Distribution shape
- Central value
- Variability
Think of box plots as an efficient pictorial representation of data in a box.
While stem and leaf plots or histograms depict distribution better, box plots demonstrate whether the distribution is normal or skewed—showing any unusual observations. These outliers are also referred to as the whiskers of the data set in question. Whiskers or outliers indicate the variability of the data outside of the external quartiles. Outliers that significantly differ from the remainder of the dataset are sometimes marked individually on the box plot, outside the whiskers.
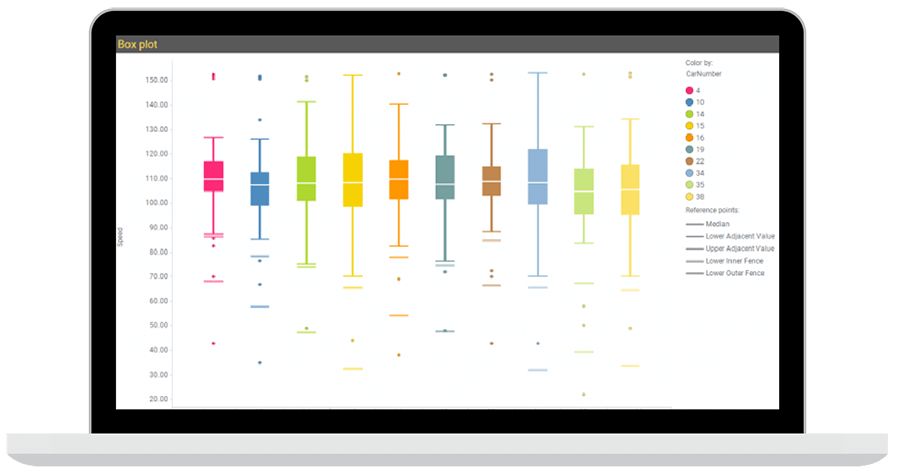
Box plots are non-parametric. This means that they display variations in the sample of statistical sets, but do not make any assumptions about the distribution. The degree of spread or dispersion is shown by the spaces in between each one of the subsections of the box plot, while the five-point summary is employed to describe any skewed data. Box plots can be horizontal or vertical, and they are most useful when comparing a large number of data sets.
Box plots are also one of the key ways to show a central tendency in the data. Central tendency is a summary measure which attempts to describe the entire data set using a single central value that represents the middle part of the data distribution. Central tendency uses four measures: mean, median, mode, and midrange. While central tendency is in itself very useful, an in-depth analysis requires more than just the central tendency measure. Box plots assist in discerning how the data values are spread out overall (as the center and spread of data is available at a glance), making it easy for users to compare distributions. An added advantage is that box plots take up less space than other graphs or plot formats.
The workings of a data plot
The box plot has two main parts: a box and the whiskers. The bottom of the lower whisker (or the lowest point) is the 0th percentile of the data set, and it excludes any outliers. The boundary of the upper whisker, the highest point, is the maximum value of the data set, again excluding any outliers. The box is drawn from the first quartile to the third quartile and a horizontal line is drawn through it to represent the median.
Whiskers can depict and represent a few things:
- The maximum and minimum score
- One standard deviation both below and above the mean
- The 9th and the 91st percentiles
- The 2nd and the 98th percentiles
Box plots often have whiskers. There are percentiles of 2 percent, 9 percent, 91 percent, and 98 percent. These unusual percentiles are sometimes used for “whisker cross hatches” or “whisker ends.” If the data in question is distributed normally, the locations of these seven points will be spaced equally on the box plot.
Variations on the box plot
The two most commonly found versions of box plots are notched box plots and variable width box plots.
Variable width box plots
Variable width box plots show the size of each data group by making the box width in proportion to the size of the data group. You can also make the box width in proportion to the square root of the group size.
Notched box plots
Notched box plots have a notch or indent in the box at the median mark. These notches offer a rough guide on the significance of median differences. Non-overlapping notches of two boxes indicates a statistically significant difference between the medians.
Adjusted box plots
Adjusted box plots demonstrate the skewness of distributions. It uses the medcouple statistic, which measures how a univariate distribution is skewed. It can be further defined as the median difference of the right and left halves of the distribution. Given its robustness, it is suitable to help identify outliers on the adjusted boxplots.
Ordinary boxplots are not the best visualization tool if the distribution is skewed, as they recognize the longer and unsymmetrical tails as outliers. Therefore, the medcouple is utilized to adjust the whiskers of the boxplot for skewed distribution. This allows for a more accurate identification of outliers in non-symmetrical distributions.
Violin plots
A violin plot is a hybrid version of a kernel density plot and a box plot. They are generally useful for showing peaks in the data. Like normal box plots, they visualize the distribution of numerical data, but a box plot can only represent the summary of statistics. The violin plot depicts both the summary statistics as well as the density of each variable in the data set.
Violin plots are a simple but compact way to compare distributions between groups. More markings can be added to a violin plot to show the same information as a box plot, but this sometimes leads to a noisier plot, which is more complex to read.
Letter-value plots
While box plots are a great way of displaying summarized distributions of a data set, they become increasingly inaccurate with large data sets. Additionally, box plots are not easy to understand. Boxen, or letter value plots, are an advancement on regular box plots, specifically designed to visualize distributions more accurately.
In letter value plots, it is not just the quartiles that are shown. The remaining data spaces are divided to represent the smaller spaces of the data set using the addition of more boxes. This step can be continued and repeated indefinitely until the very last data point is reached, but this would make the plot very complex and confusing to read, and there is still the need to detect and visualize the outliers.
This is why a stopping criterion is used to determine the last letter value, depicted as “k.” The trustworthiness of each letter value is determined by calculating the 95 percent confidence interval around the letter value. If this interval overlaps with the previous one, then the uncertainty of the current value is very high. In which case, the letter value after this is not displayed anymore.
The usefulness and drawbacks of box plots
When compared to histograms or kernel density estimates, box plots come across as slightly primitive; however, they do offer a few clear advantages:
- Enables statisticians to quickly examine one or more data sets graphically
- Takes up less space, useful for parallelly comparing distributions between several data sets
- Shows outliers, visualizing obscure results
Box plots also have some drawbacks:
- Can inaccurately visualize larger sets of data with outliers
- Can be difficult to understand and interpret, especially for complex data subjects
- Do not retain the exact values or details of the distribution results, which can be an issue when handling larger amounts of data
- Can obscure some information such as the mean or the multimodality characteristic of the distribution.
Comparing and reading box plots
There are a number of ways that box plots can be read and interpreted:
- When comparing the respective medians of each box plot, note the position of the median line. If the median line is outside of the box, then there is a likely difference between the two groups under comparison.
- Compare the lengths of the box (the interquartile range) to examine the data dispersion between each sample. The data will be more dispersed if the box is longer and vice versa for a smaller box.
- The overall spread of the data is represented by the extreme values at the end of the whiskers. This displays the range of scores, which is also a type of dispersion. A large range means a wider distribution or more scattered data.
- An outlier is the data point that lies outside the whiskers of the box plot. Looking for potential outliers is necessary for correctly analyzing the data.
- If the distance between the median and maximum is greater than the distance between the median to minimum, then the box plot is skewed positively.
- If the distance between median and minimum is greater as compared to the distance between median to the maximum, then the box plot is negatively skewed.
- The box plot is referred to as being symmetric if the median is equidistant from both the maximum and minimum values.
To conclude, boxplots are useful graphics that display a lot of information in minimal space and are best employed at the very beginning of data analysis to better identify early patterns of data. For readers who understand box plots, they show a wealth of information at a glance. However, for users who do not understand what a box plot conveys, they can be confusing or misinterpreted.